19 Mar 2026
- Attendees:
Petrovic, D. Waterman, D. McDonagh
Results
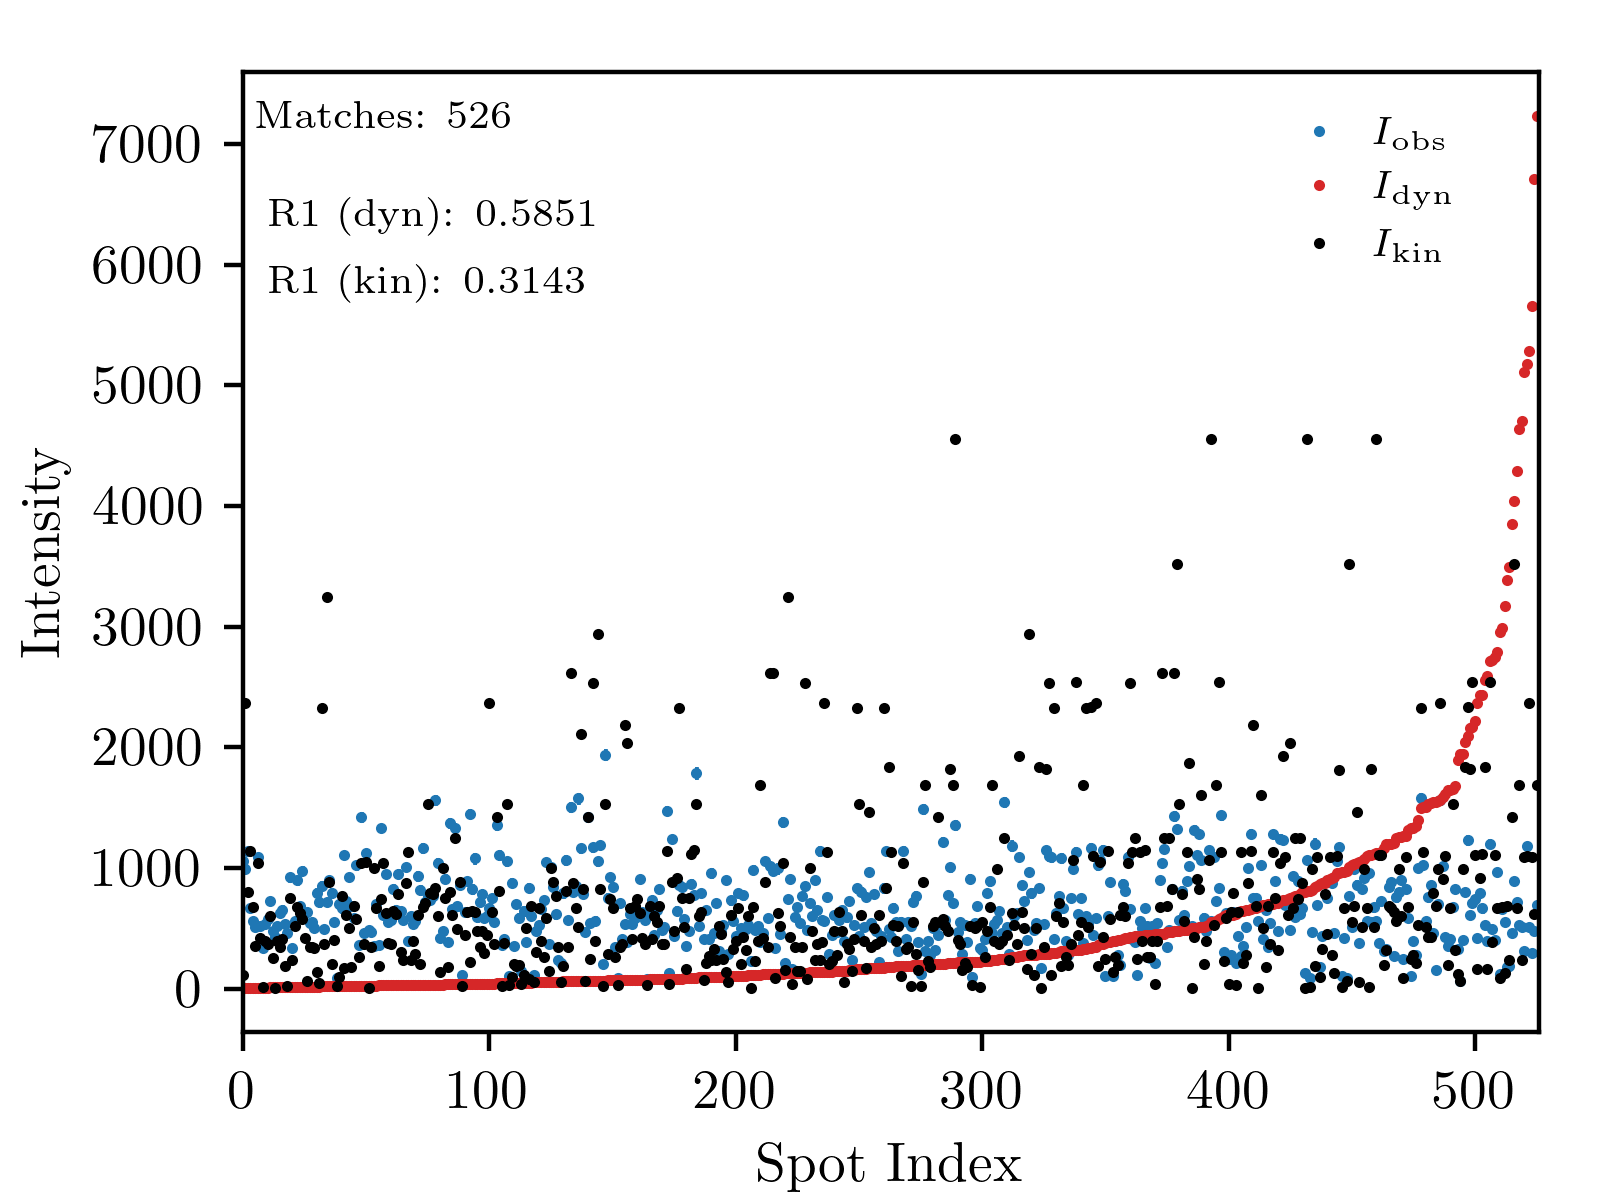
Did a simulation of the chiral molecule again using the abTEM Bloch wave method (I had not used this method on this material before). The results were worse than those obtained with the kinematic approximation (Fig. 1). It may be that the dataset was just bad, or the simulation is missing something more fundamental.
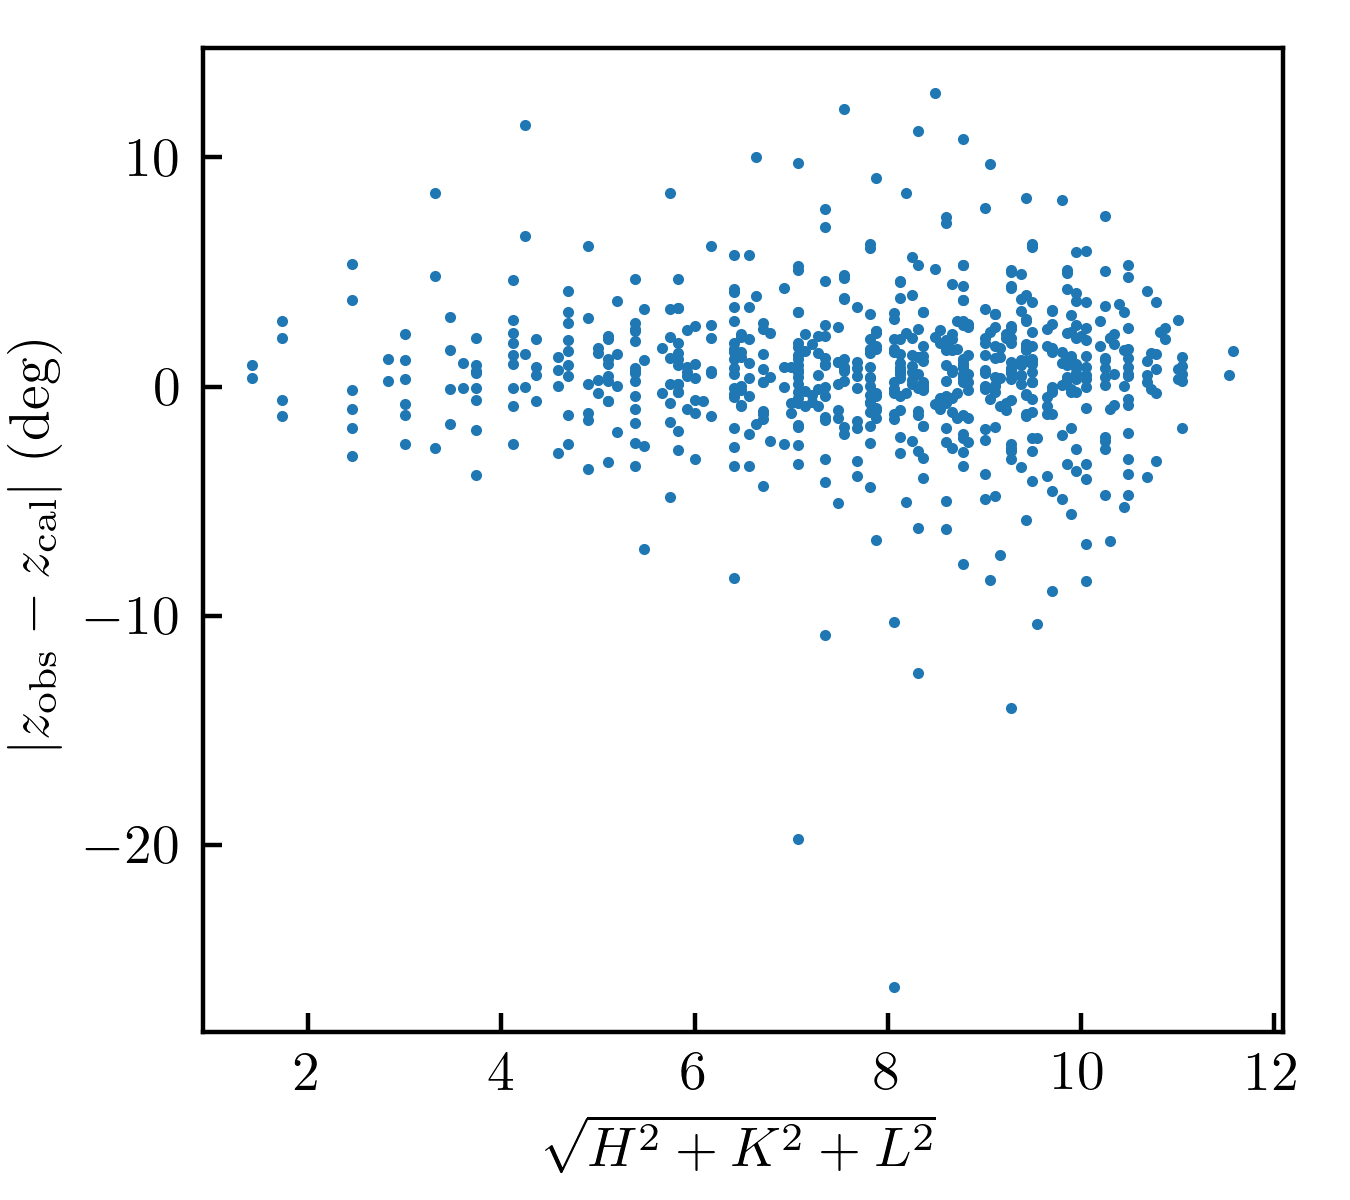
Another issue with the abTEM simulation is that some measured spot positions match the simulated rocking curve maximum for those spots. But in some spots, the measured and simulated positions in the rotational scan differ by many degrees (Fig. 2). It is possible that this is an indexing problem, or that some spots are just weak, and that the maximum of the rocking curve is a small number with no physical meaning.
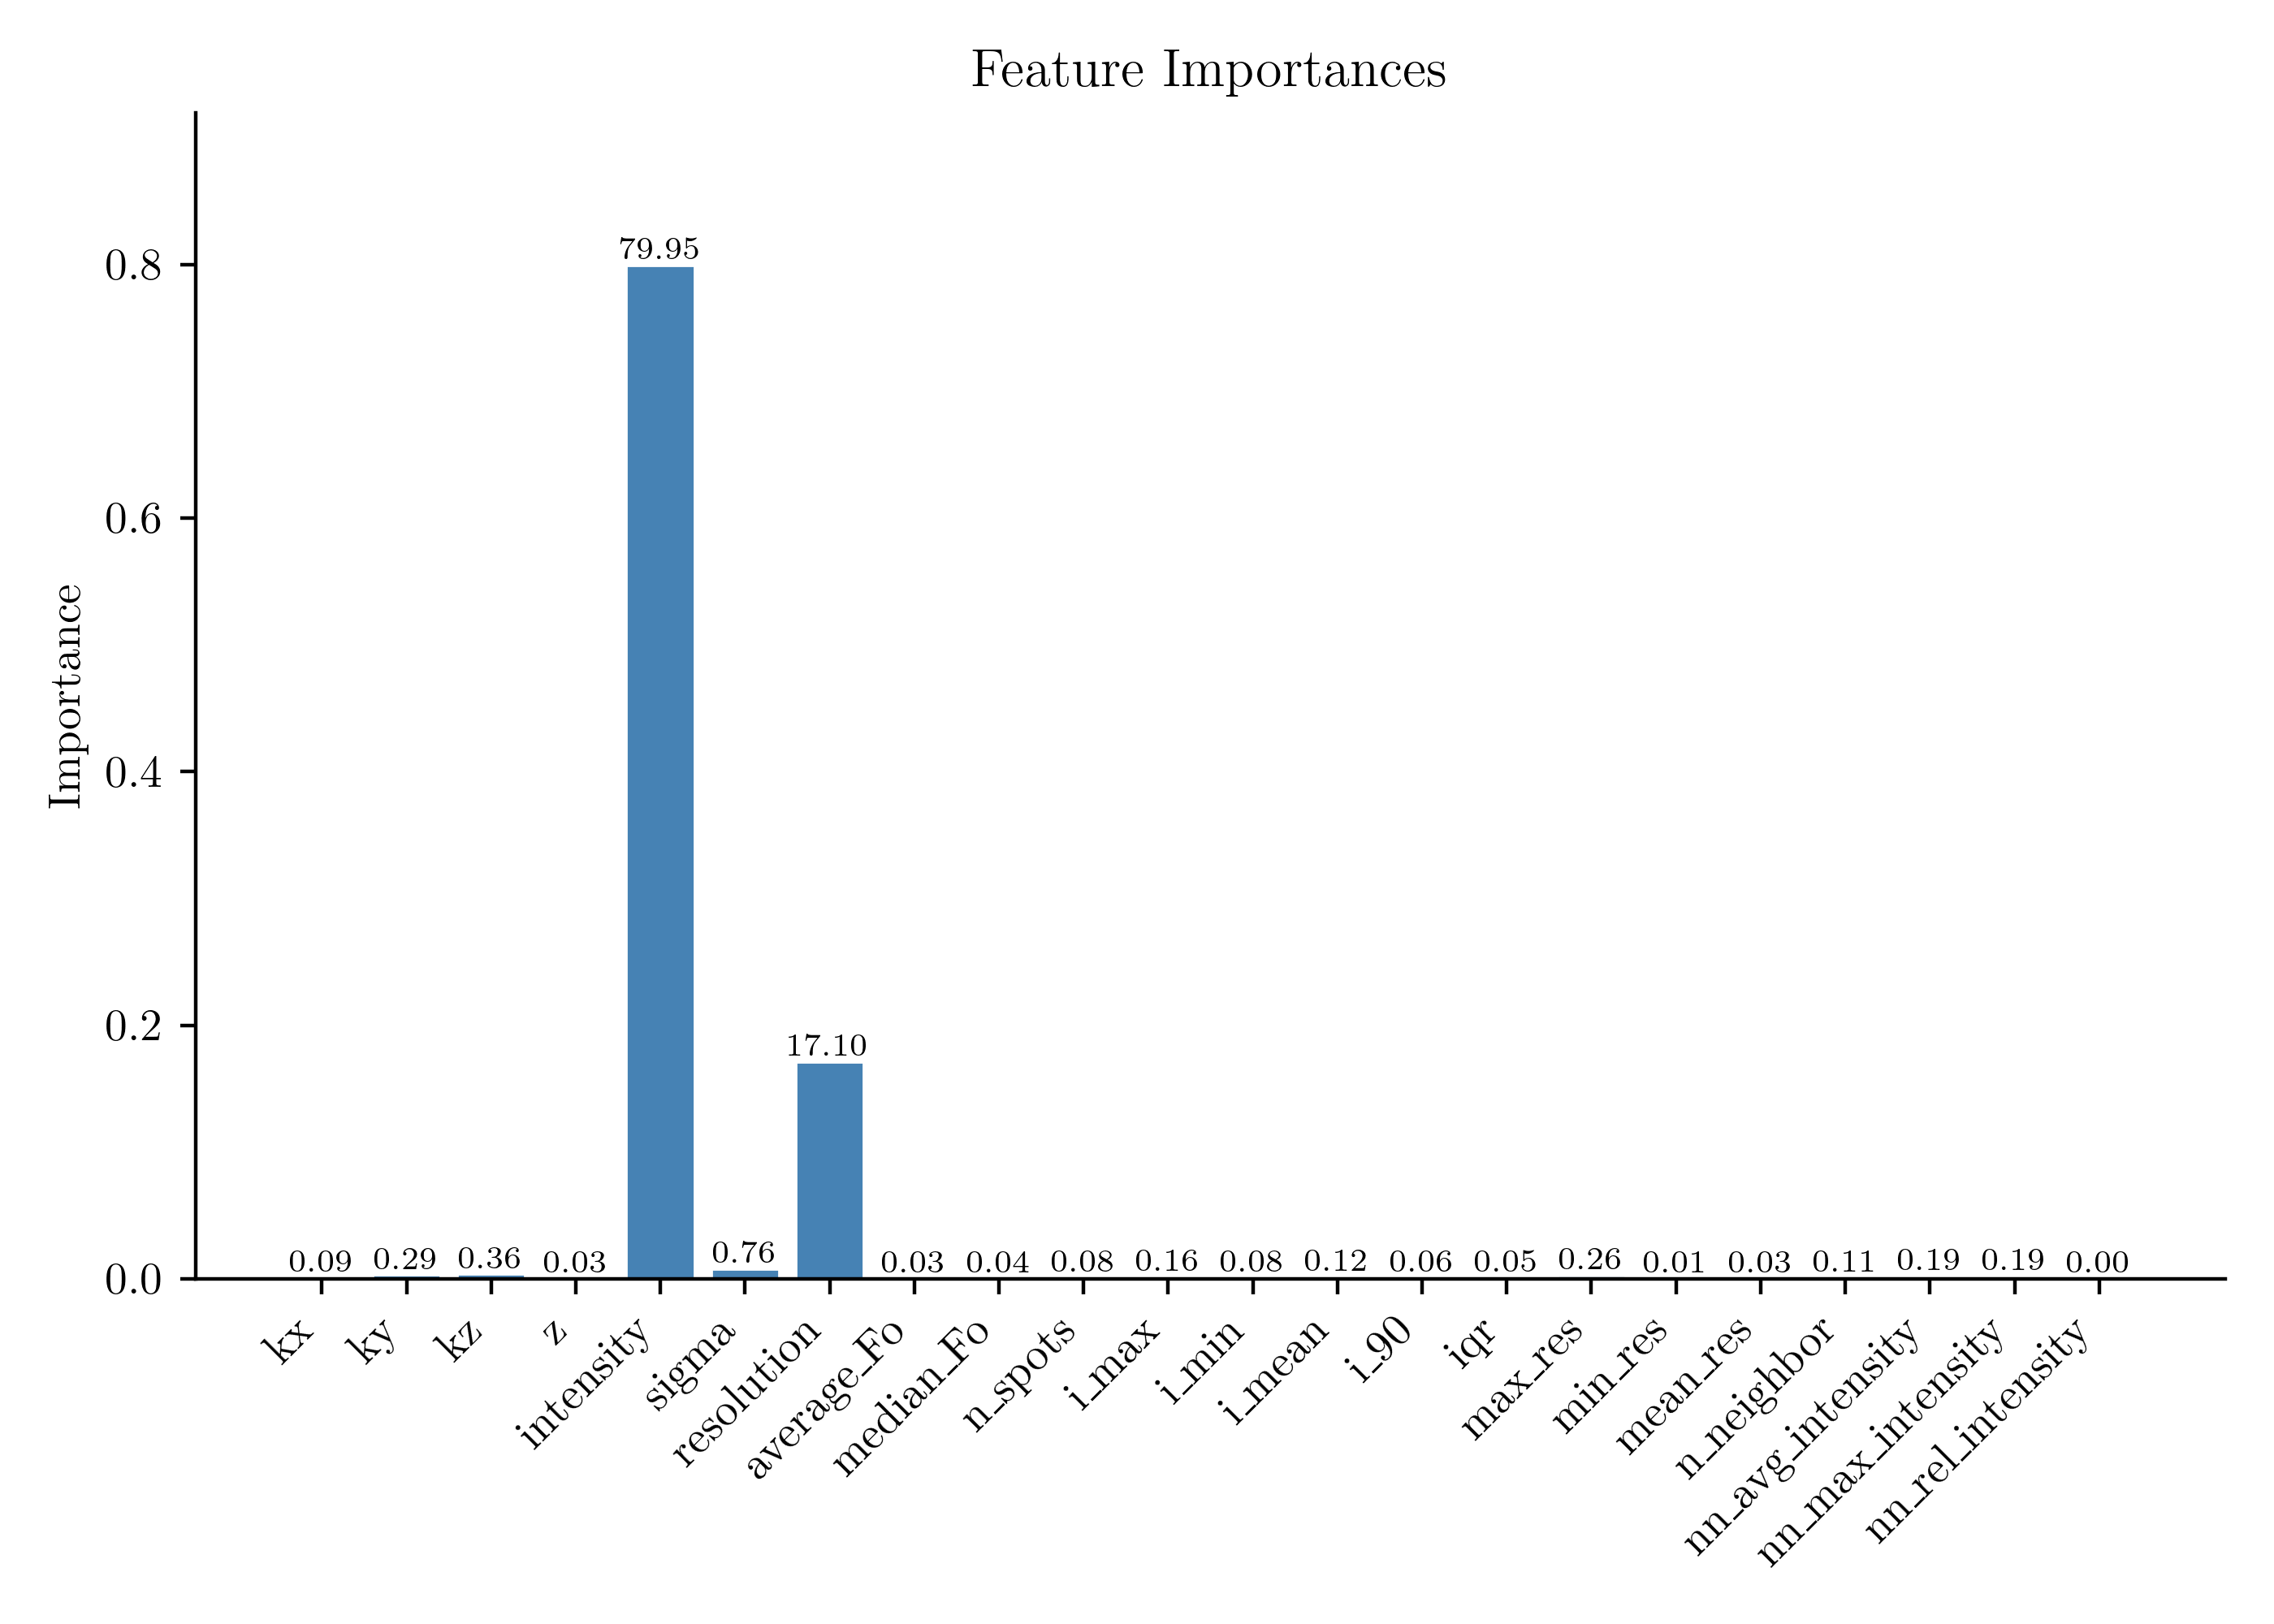
Worked out how much each property in the GBT model contributes to the prediction of the kinematic structure factor (Fig. 3). Only three properties have an actual contribution (original intensity, sigma, and the resolution). The contribution of other properties is negligible. This raises the question of how to tailor the GBT model’s properties to better contribute to prediction.
|
|
|
Fig. 1: Chiral sulfoxide abTEM (Bloch wave) simulation vs. measured intensities. |
Fig. 2: The difference between observed spot intensity and the maximum of the simulated rocking curve versus Miller index distance. Paracetamol data, simulated with abTEM (Bloch wave). |
Fig. 3: Contribution of each GBT parameter to the prediction of the corrected structure factor. |
Discussion
Try other sulfoxide datasets to confirm angle difference is systematic and not a consequence of a single (maybe low-quality) dataset.
Run TPOT on your GBT model.