22 Jan 2026
- Attendees:
Petrovic, D. McDonagh, D. Waterman, E. Krissinel
Results
David W. provided a fixed processing script for IRELOH.
To confirm that our processing pipeline is correct, we compare Fc vs Fo plots generated from the original data (using DIALS) with the original Fc vs Fo graph (processed with XDS). Figures 1 and 2 show these plots. In general, we do not get exactly the same spots, but the number of spots and the hyperbolic fit match with the original. The comparison of original results vs our processing pipeline in Fig. 3 confirms that (within the level of noise) our pipeline matches that of the XDS.
Note on merging. The data in Figs 1-3 were obtained by processing with DIALS + shelxt and then exporting the fcf files. We only get the match if we either process with shelx (which does the merging) and then export the hkl to fcf files, or we merge and then export to hkl. If we only scale the data, but not merge it, and if we export it to hkl (without running shelxt), we will get a lot of spots for the same Miller index, and they won’t match the linear (hyperbolic) fit of the graphs in Figs 1 and 2.
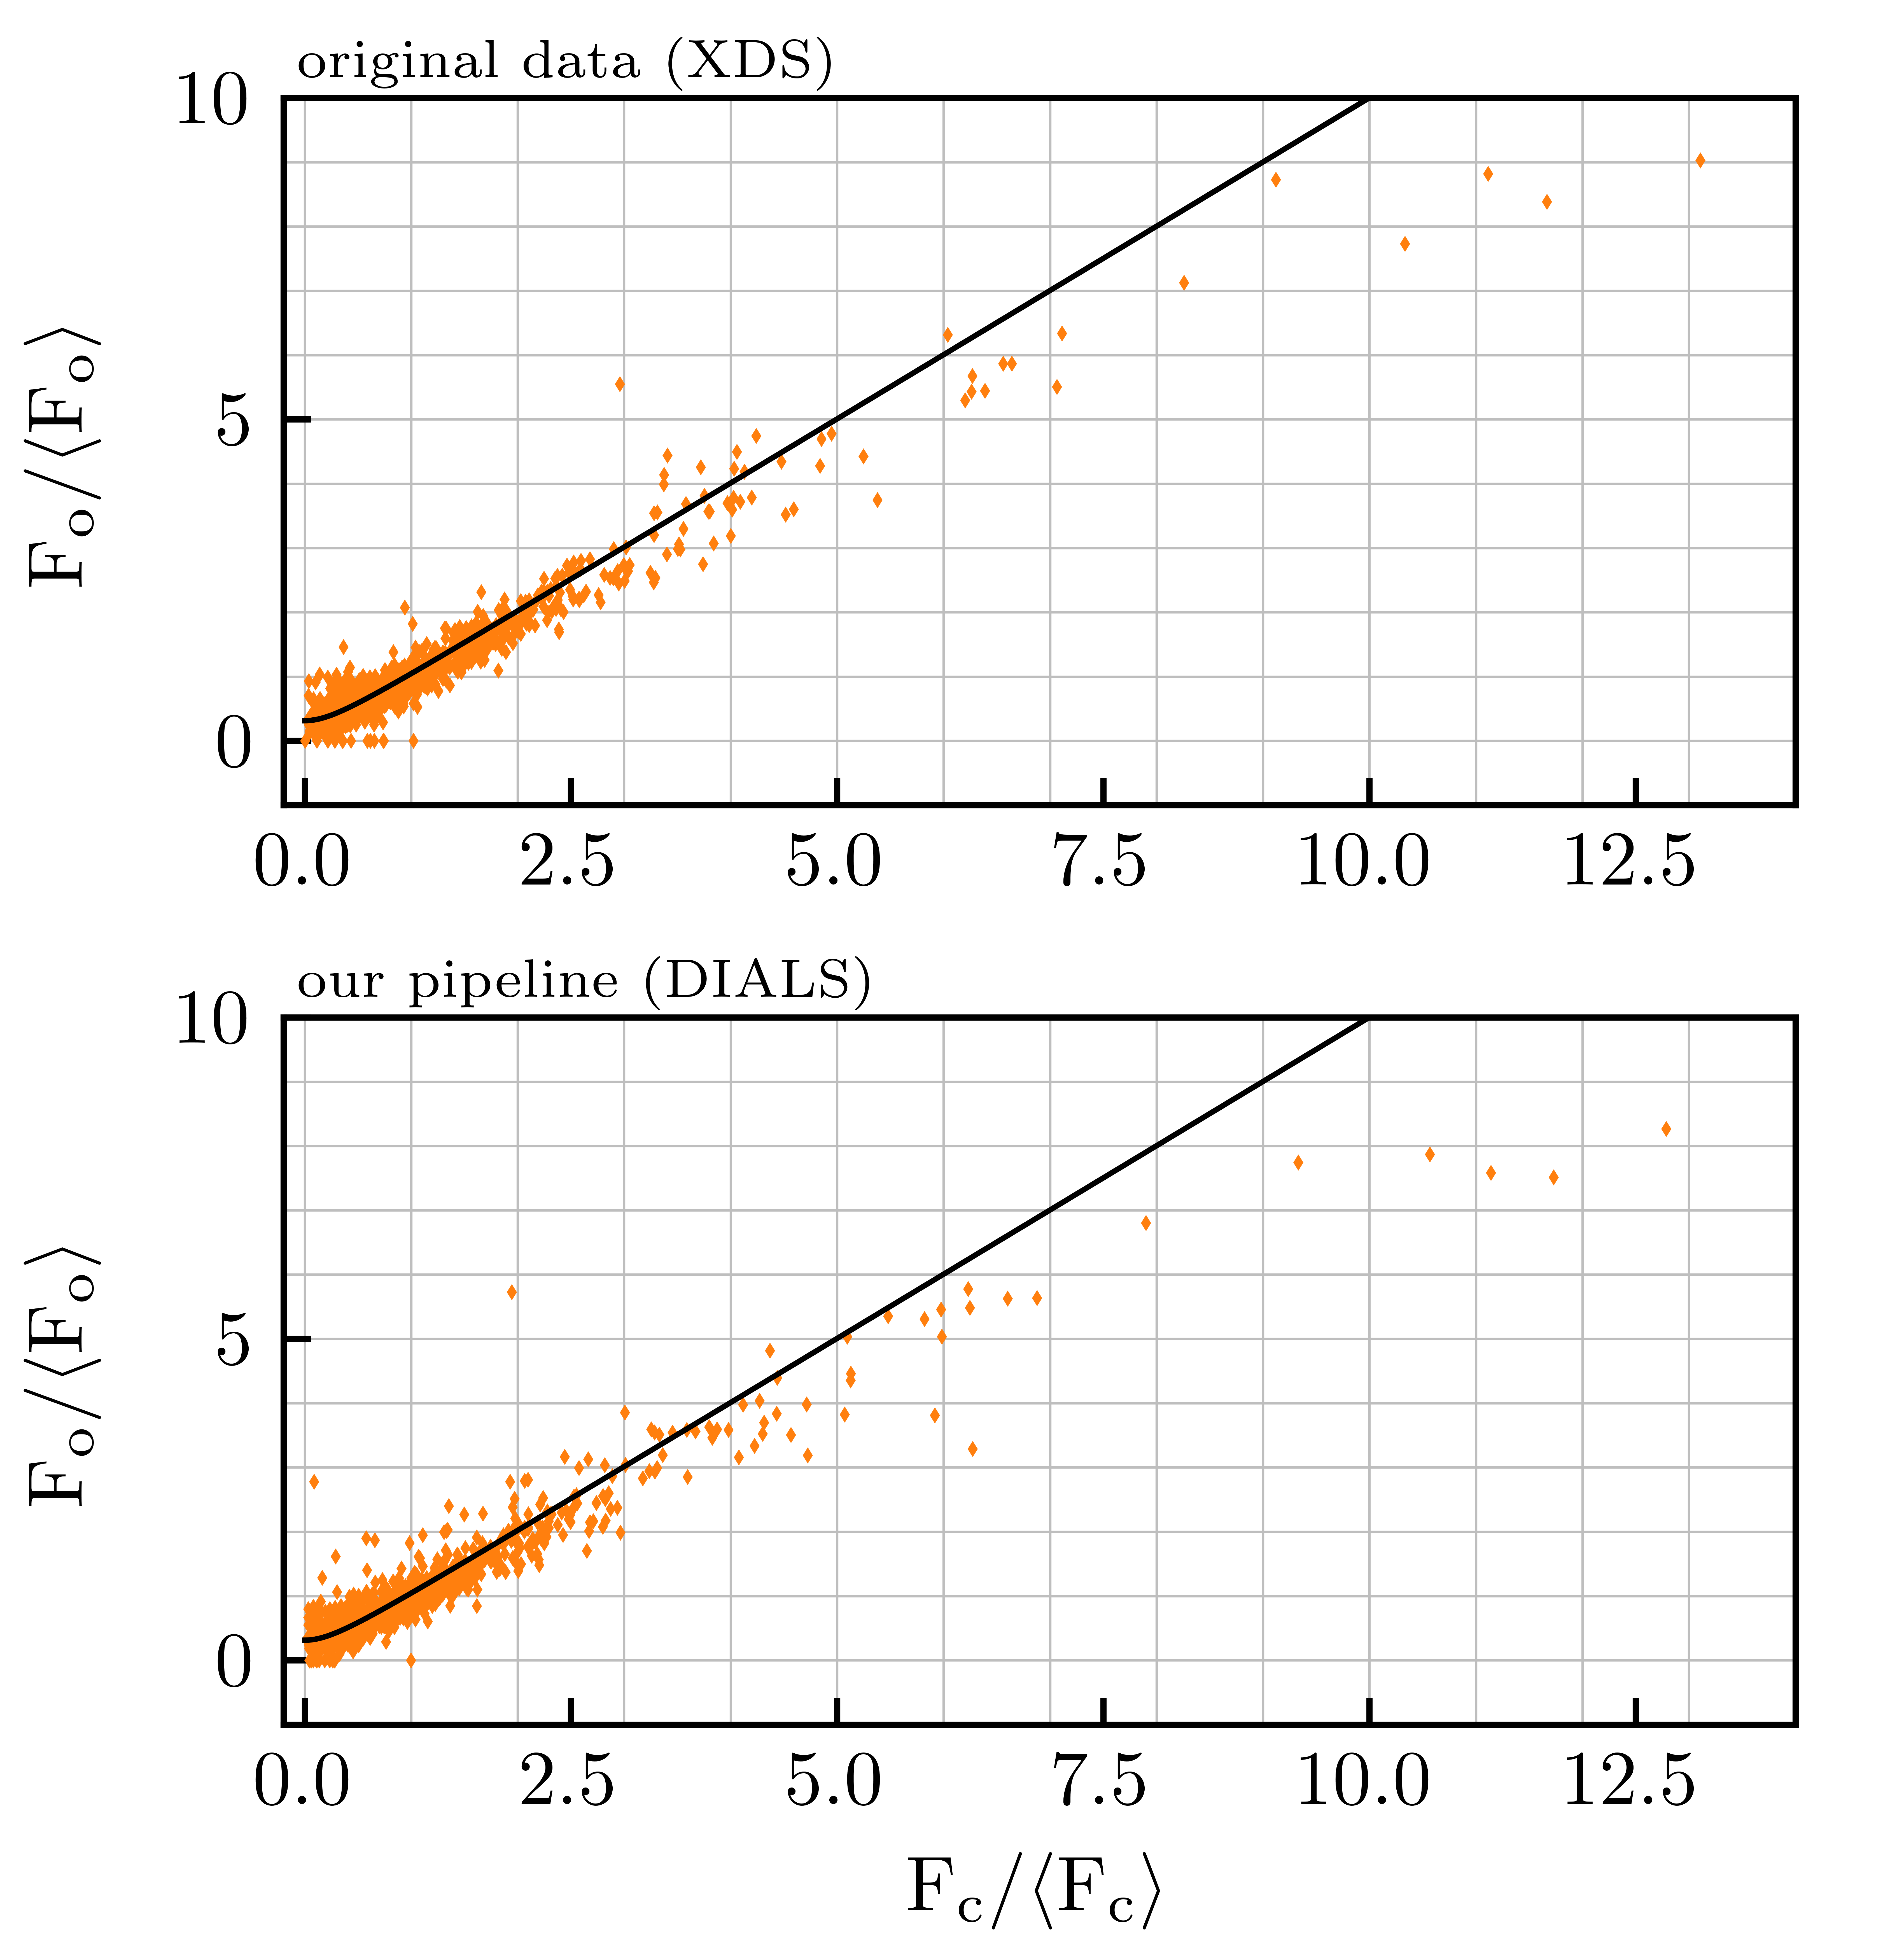
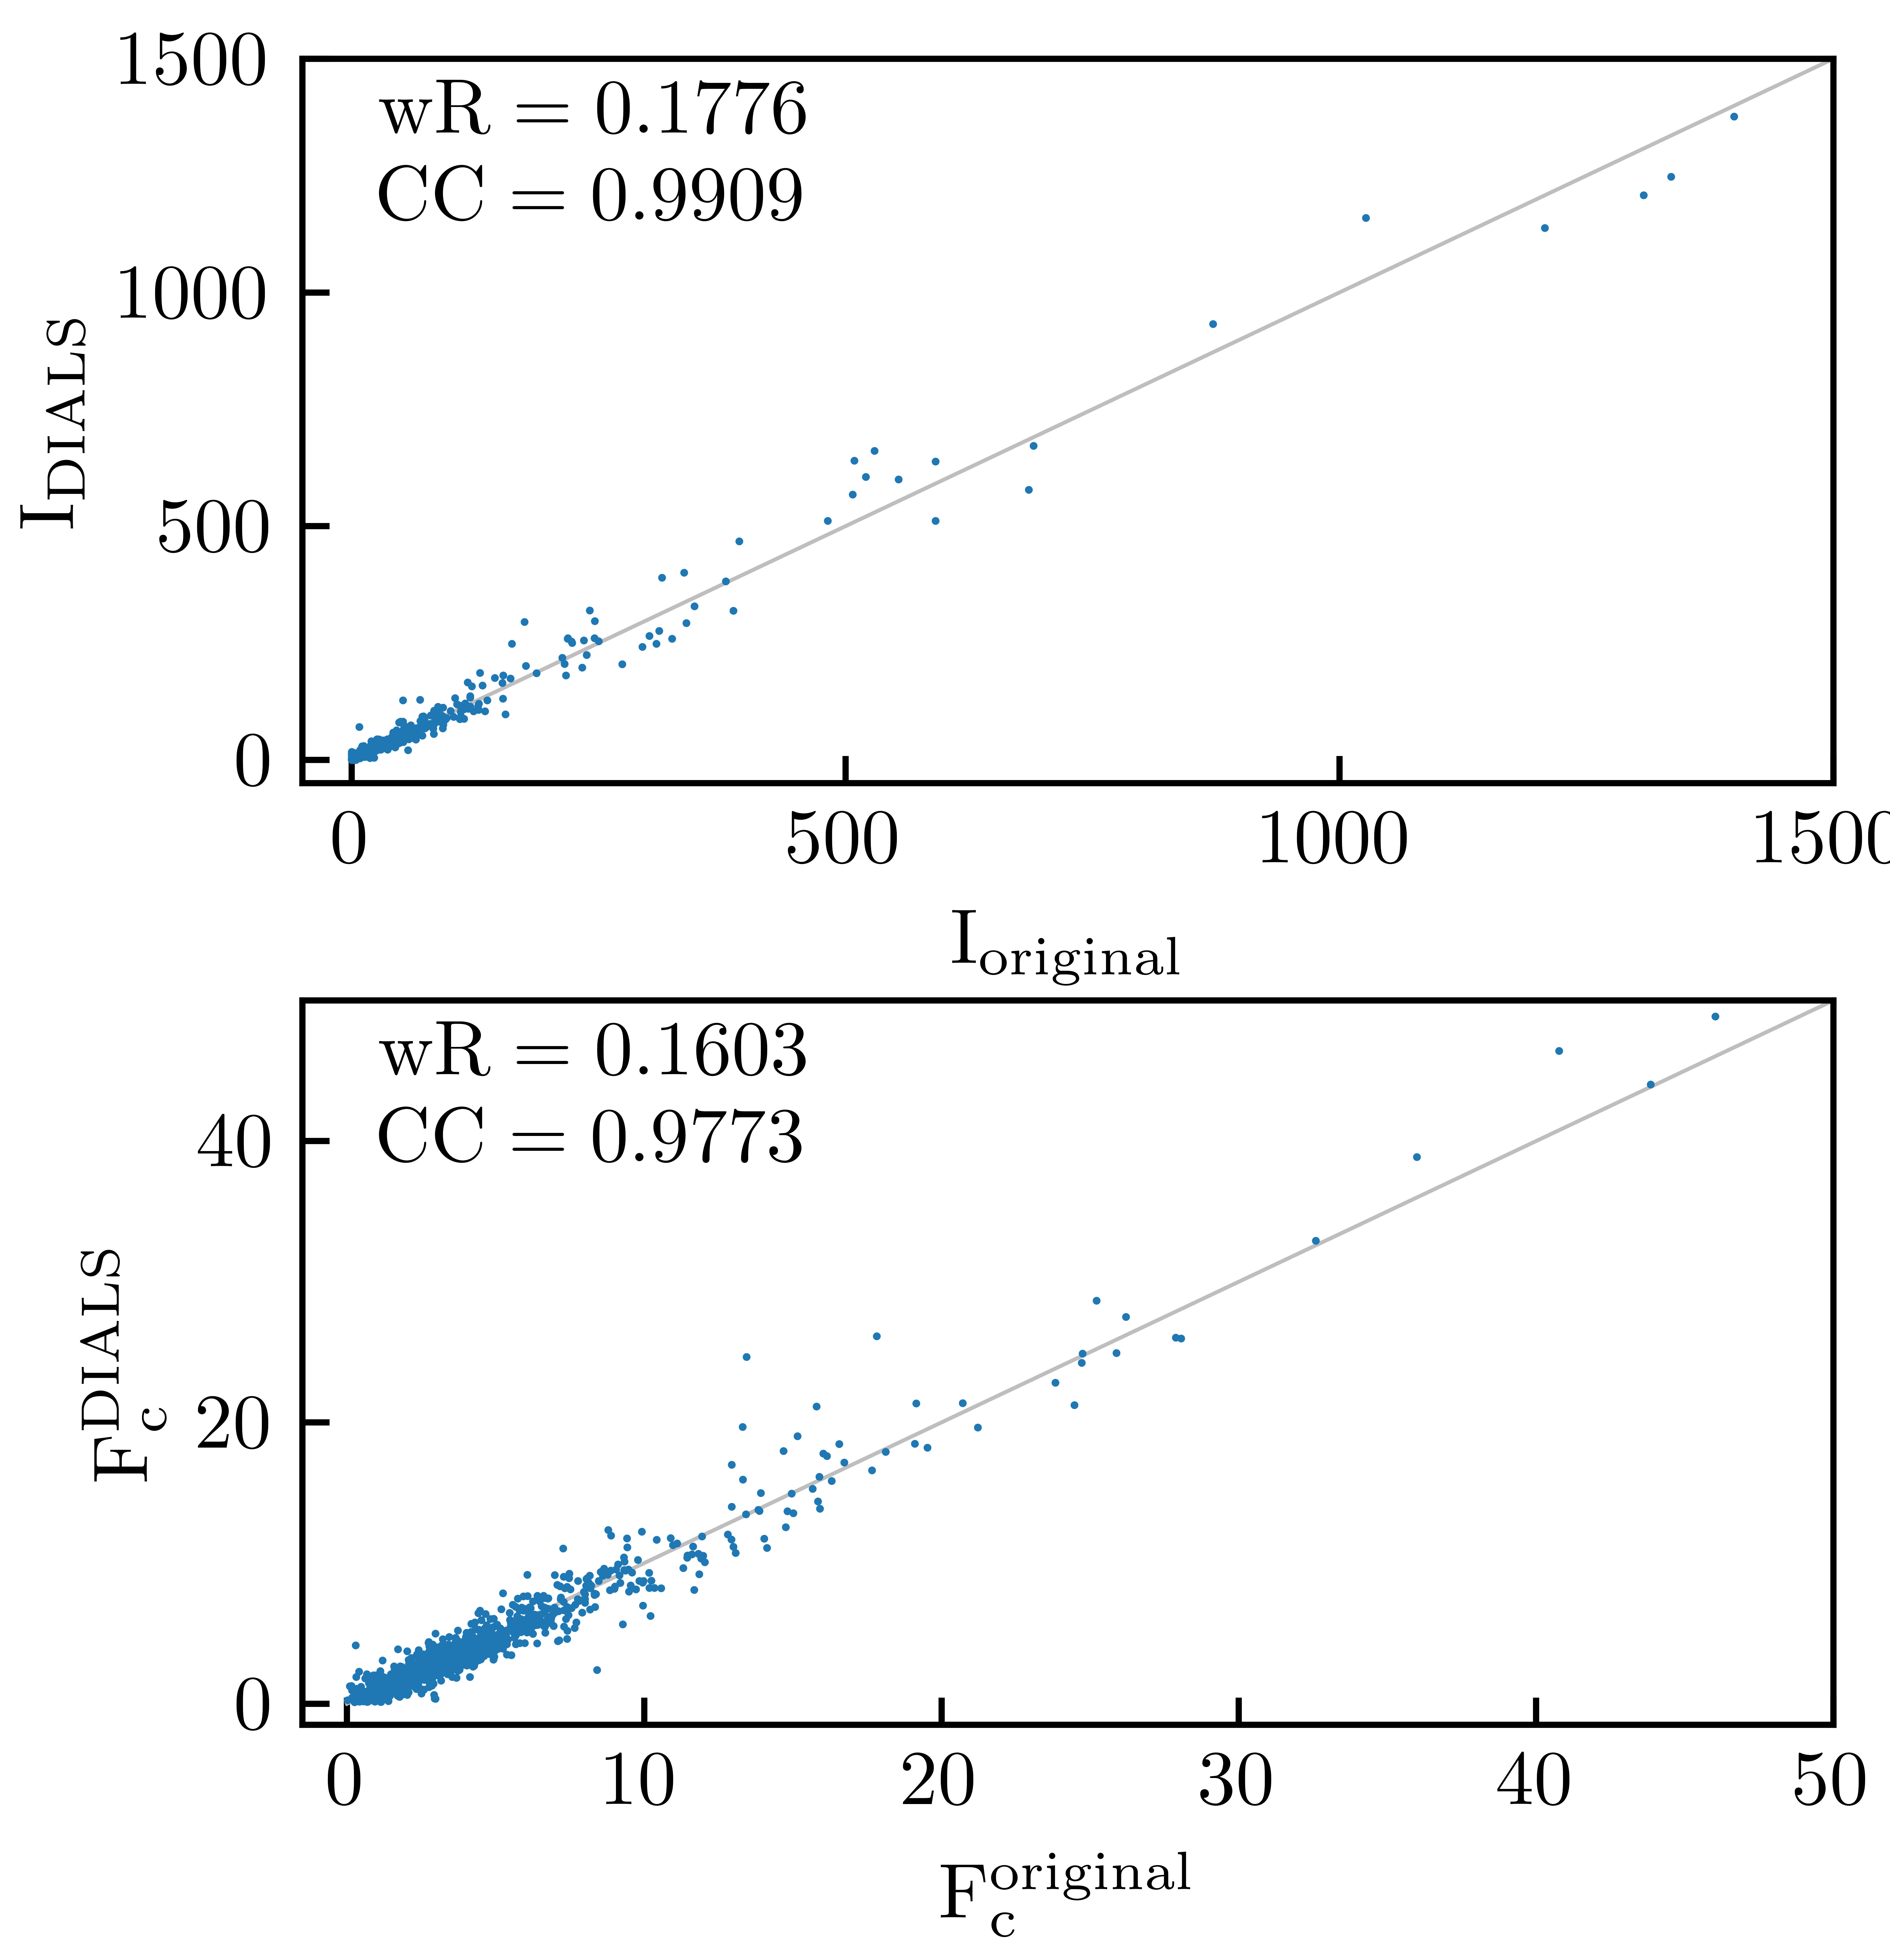
Fig. 1: Comparison between IRELOH data processed with our DIALS pipeline vs. the original data (from the paper).
Fig. 2: Same as Fig. 1, but zoomed.
Fig. 3: Comparing intensities and Fc for our pipeline (DIALS) versus the original (XDS).
Figure 4 suggests that the fit quality for the correction factor \(|\rm F_{\rm e}|\) may be highly dependent on the resolution binning parameter.
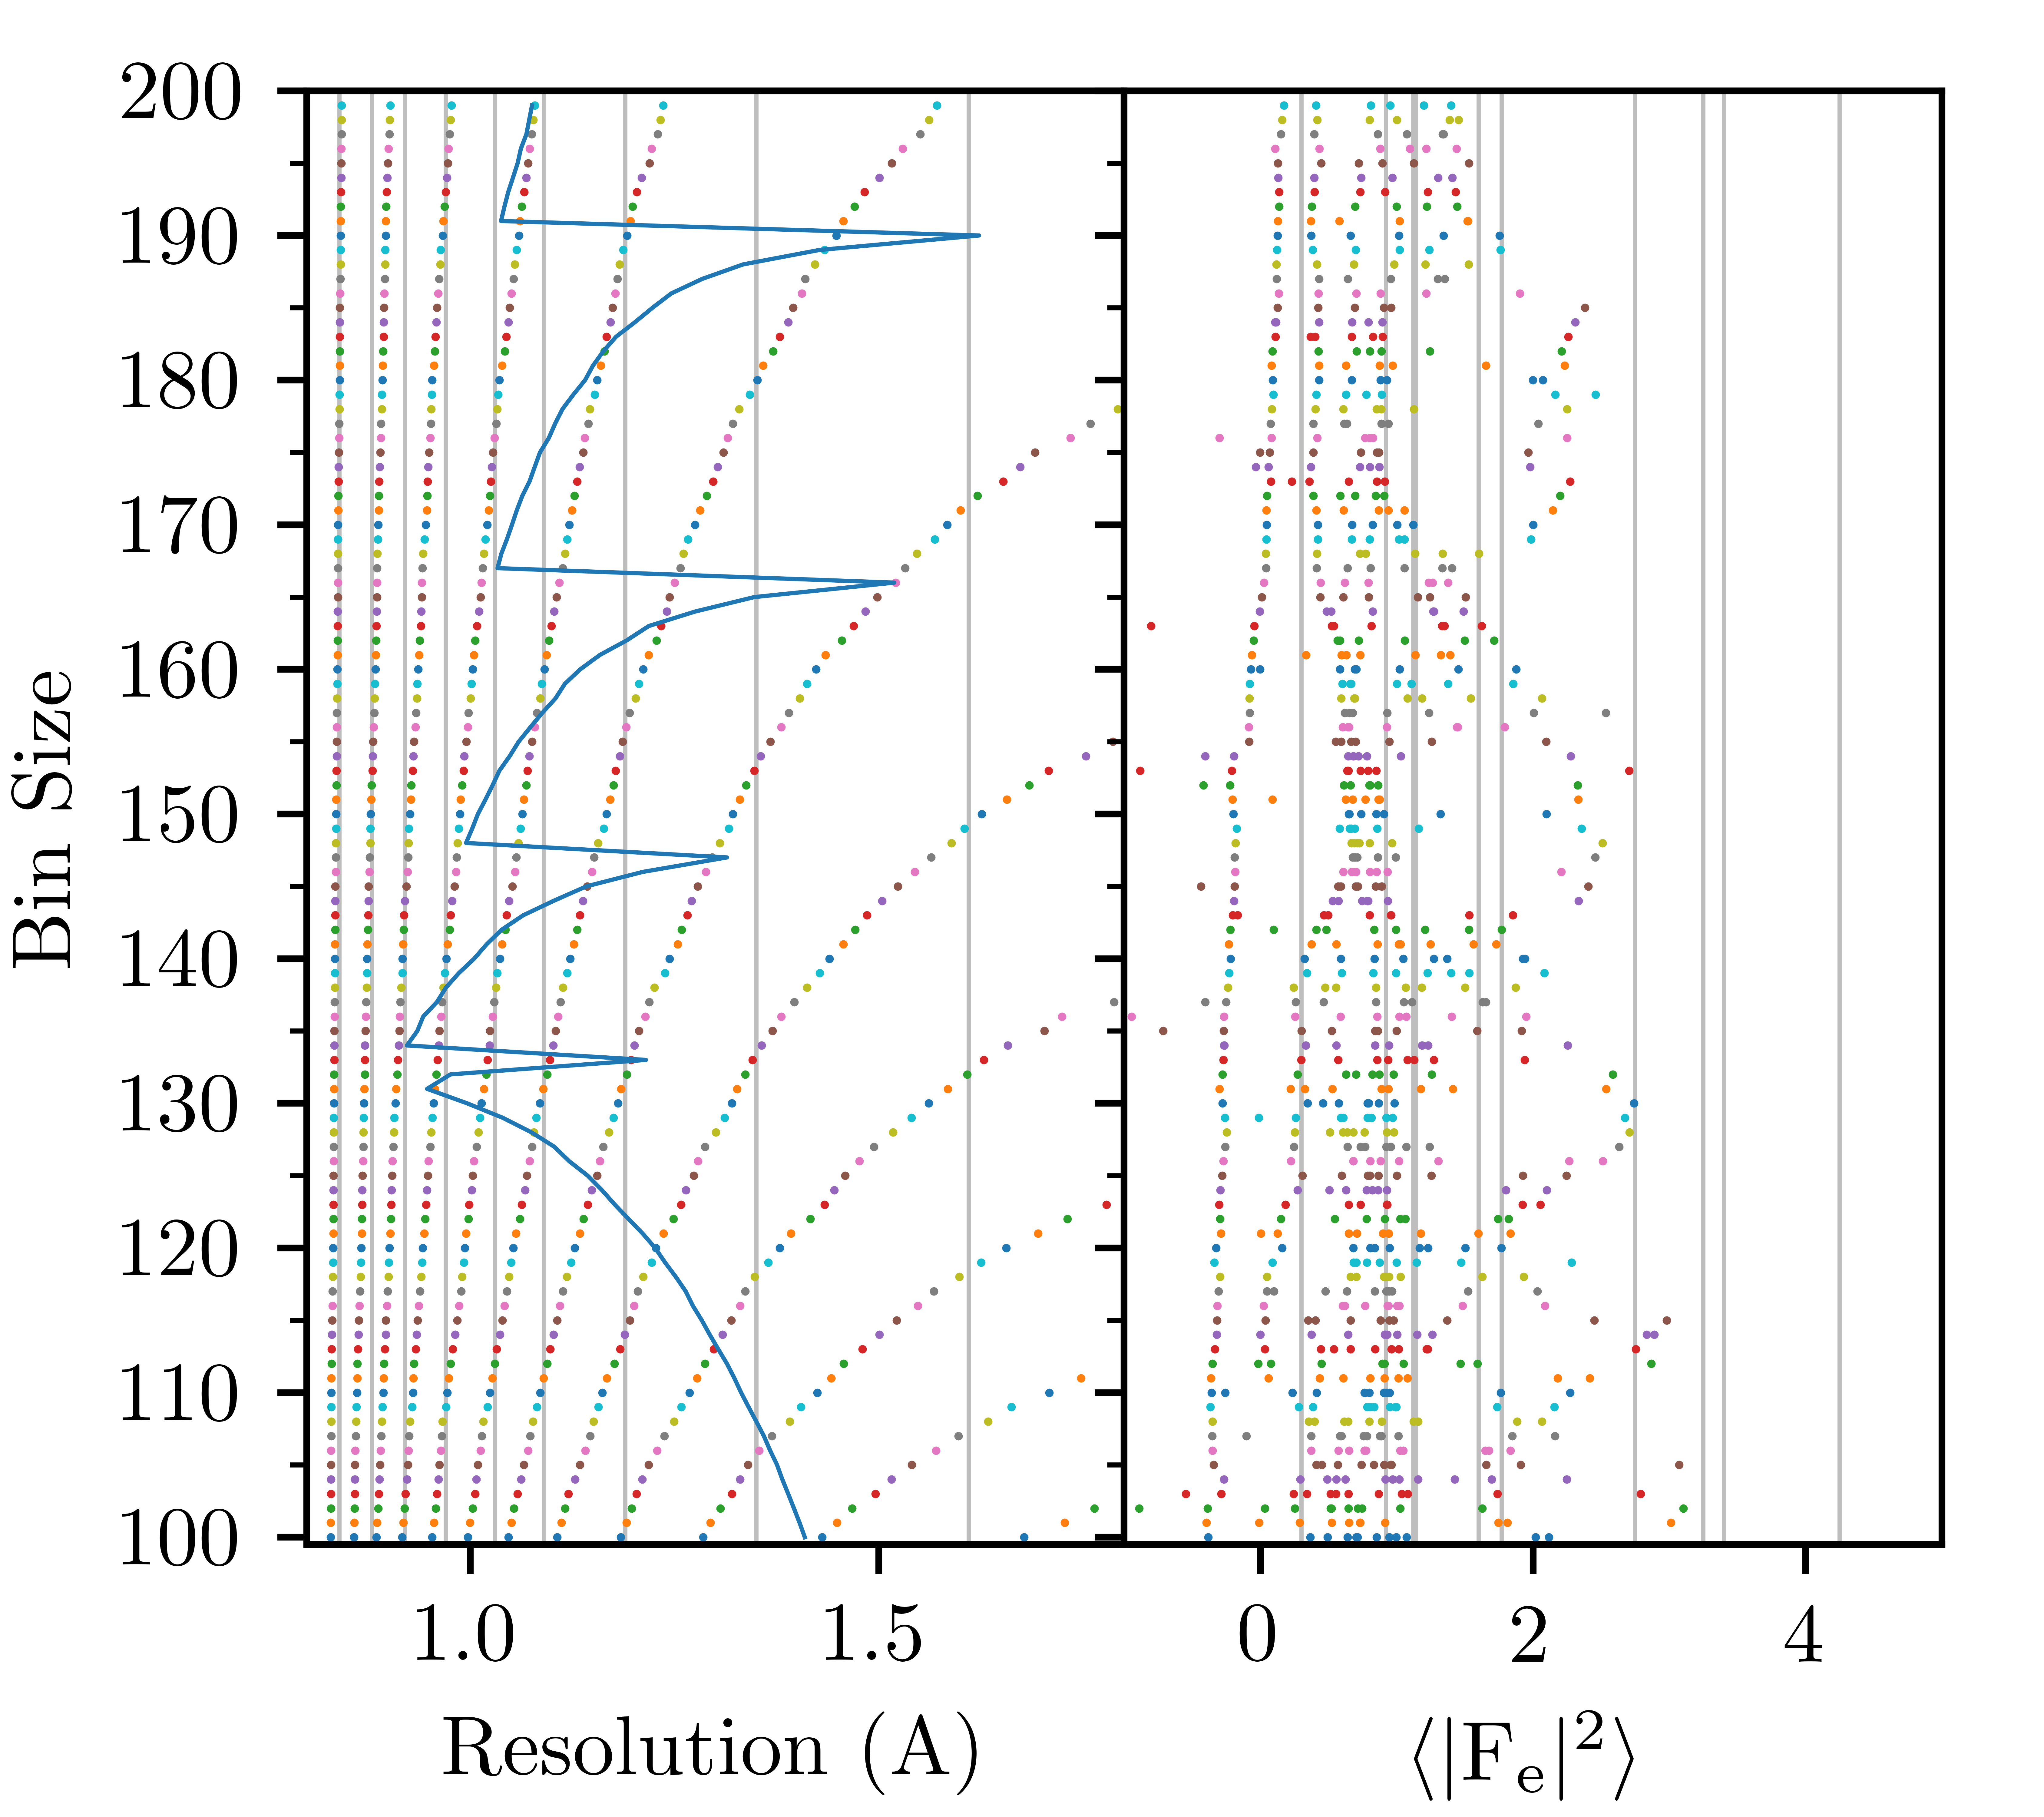
Fig. 4: Checking how resolution binning size determines the fit params for the structure factor correction \(\rm |F_{\rm e}|\). The \(\rm |F_{\rm e}|\) was computed using the original data (from supplementary information).
Implemented the excitation error in the Dynamic package. The excitation error still needs to be implemented in the GBT model (as a spot parameter).
Discussion
Test how binning affects the \(|\rm F_{\rm e}|\) fit and, thus, the quality of the structure solution. This will assess whether the bulk correction is robust.
Make plots that compare the spot excitation error vs deviation from the kinematic approximation (the magnitude of dynamical diffraction correction). Do this for the Paracetamol data on an image-by-image basis.