15 Jan 2026
- Attendees:
Petrovic, D. McDonagh, D. Waterman, E. Krissinel
Results
Tested how local GBT model (which includes per image and per dataset properties) scales with size. Data from the previous meeting was trained with 1500 estimators. We discovered that number of estimators is probably too high. The graph Fig. 1 below shows the model is probably overfit already at \(n = 100\) estimators (also checked with increased depth of \(d = 10\), which is not shown, but still, we see no inprovements in \(R_1\)).
Graph Fig. 2 below shows what happens when we put more training data. In general, the \(R_1\) factors of the new training data get better as compared when they were predicted using a smaller model (which is expected). However, the \(R_1\) factors of the initial 100 datasets get worse. This tells us that adding more data does not improve the model, and that the bottleneck is probably in the set of properties we selected (they need to be expanded, also see discussion from the previous meting).
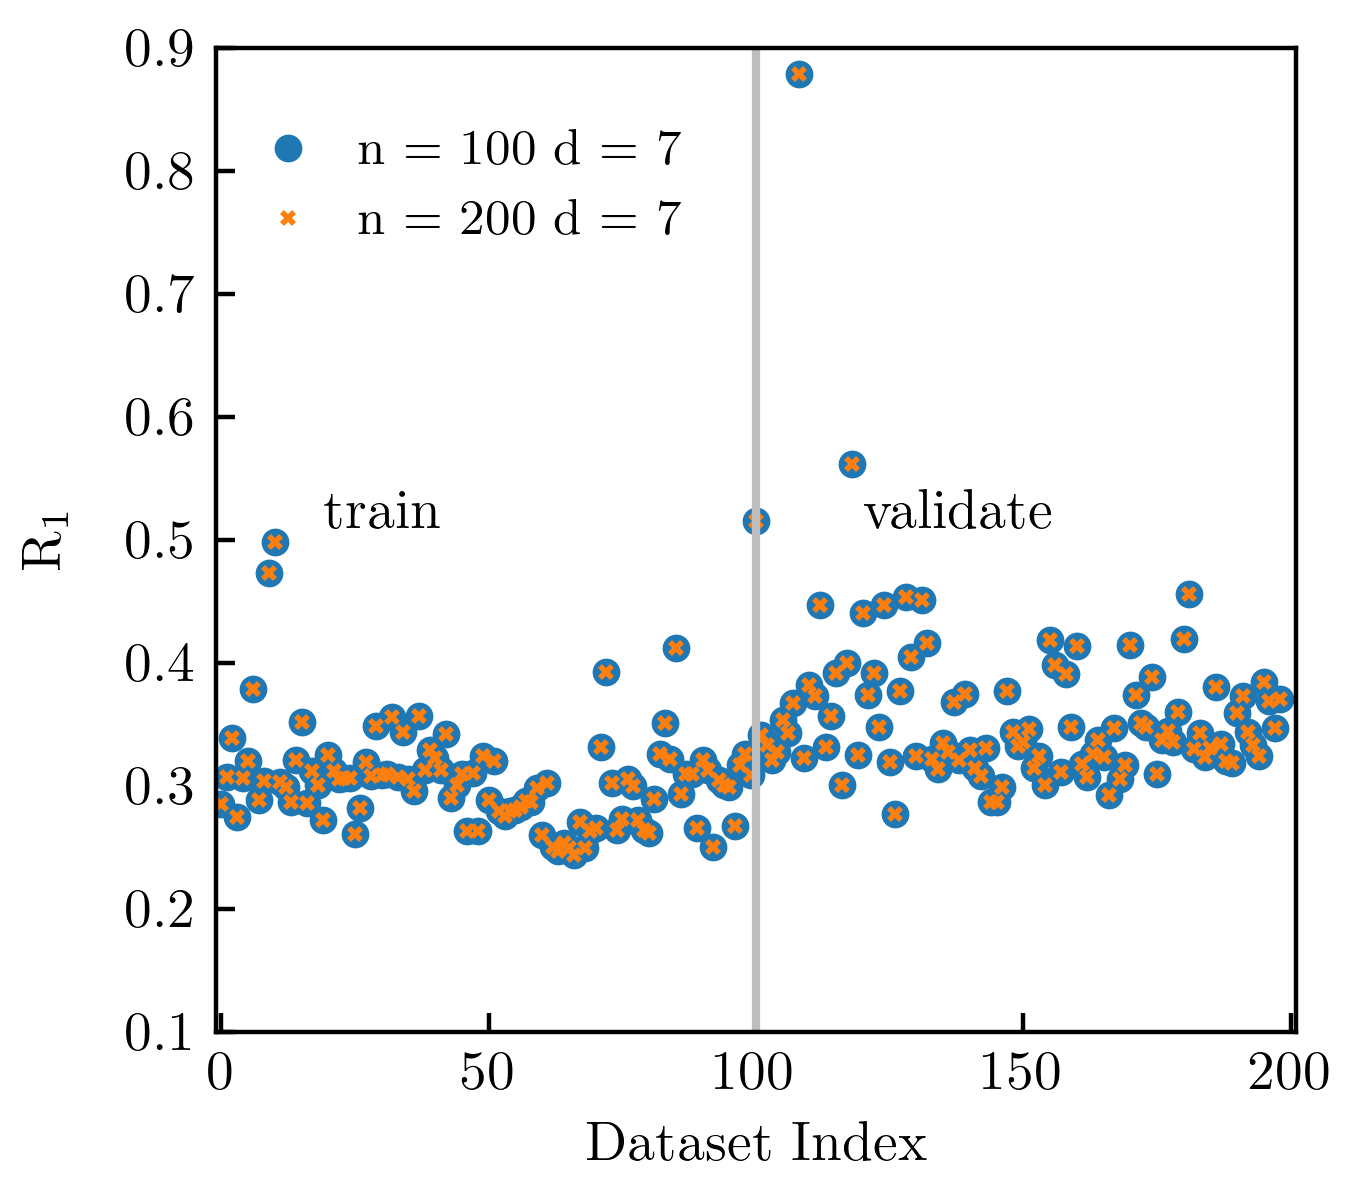
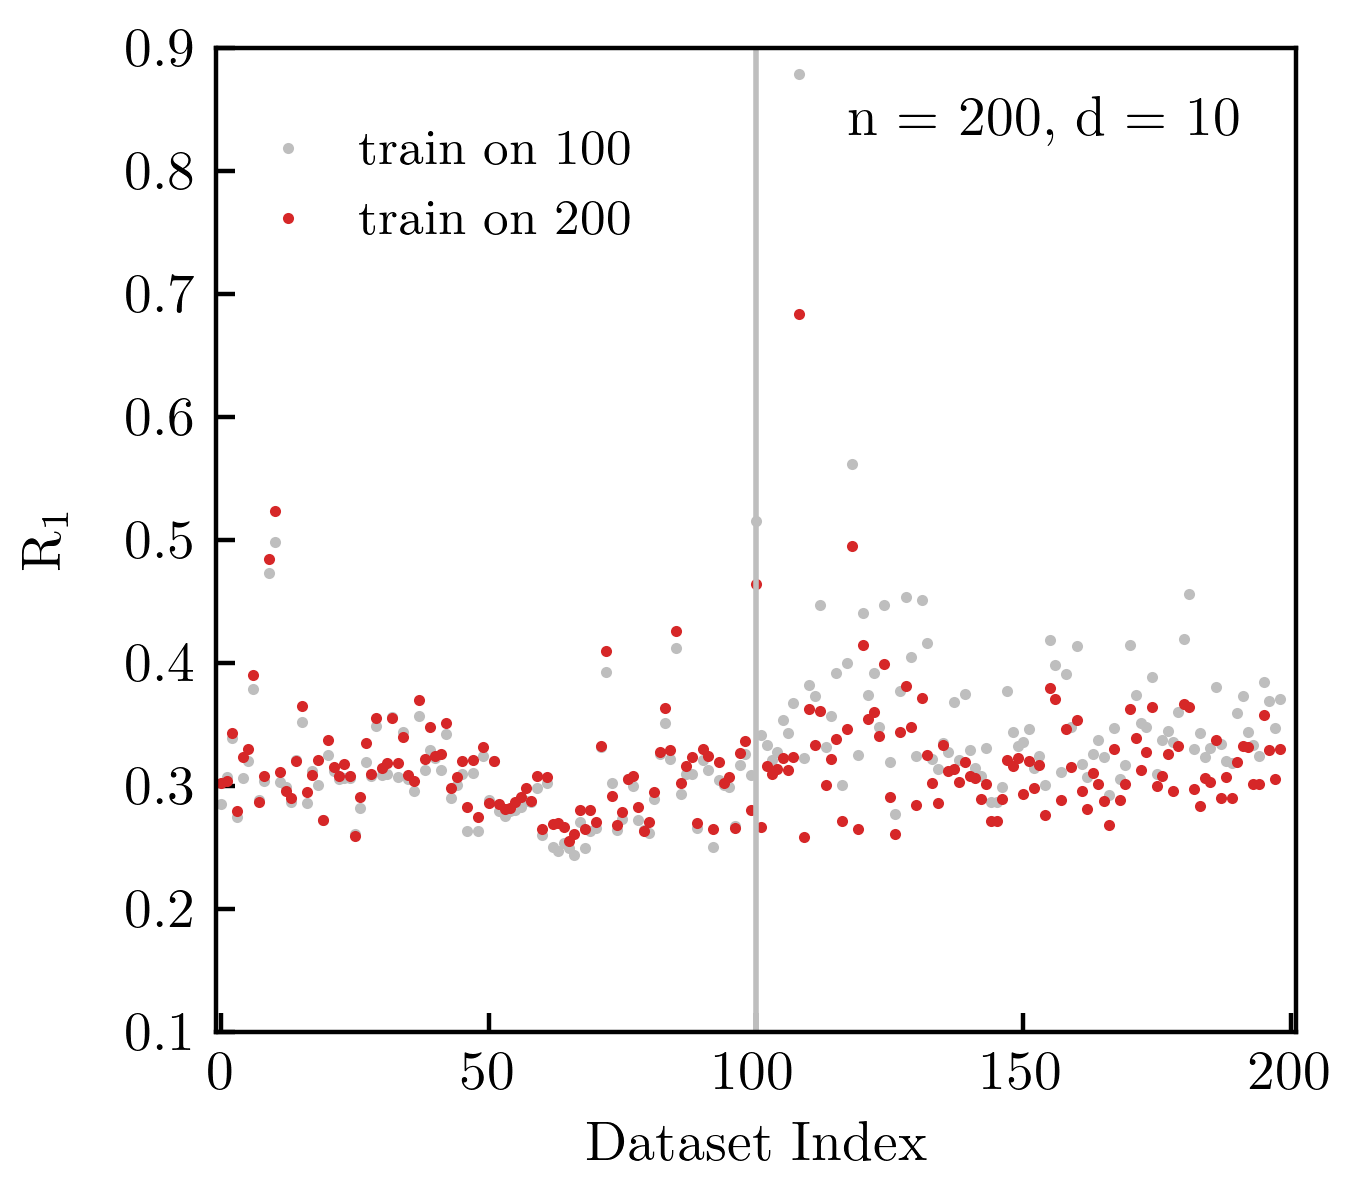
Fig. 1: Change in \(R_1\) factors as a function of the number of estimators (\(n\)) and the tree depth (\(d\)) of the GBT model. The model was trained on the first 100 datasets (Paracetamol data), and validated on the next 100 datasets.
Fig. 2: Change in \(R_1\) as a function of the amount of training data. The first model (gray spots) was trained on the first 100 datasets (and validated on the next 100), whereas the second model was trained on all 200 datasets (Paracetamol data).
We performed an abTEM simulation on a chiral sulfoxide molecule. The resulting positions of rocking curves do not match the observed spot positions. Also checked the ratio of Friedel pairs in the experiment and in the data (Fig. 5). For each pair in the experiment we compute the direction vector (if the ratio is higher than 1 we set it to 1, and if it is lower than 1 we set it to -1). Fig. 5 shows the product of these direction vector values between the experiment and the simulation. Only 50 % of pairs match (which is very low). The problem might be a high error in the direction vector (considering very similiar Friedel pair intensities and large sigmas).
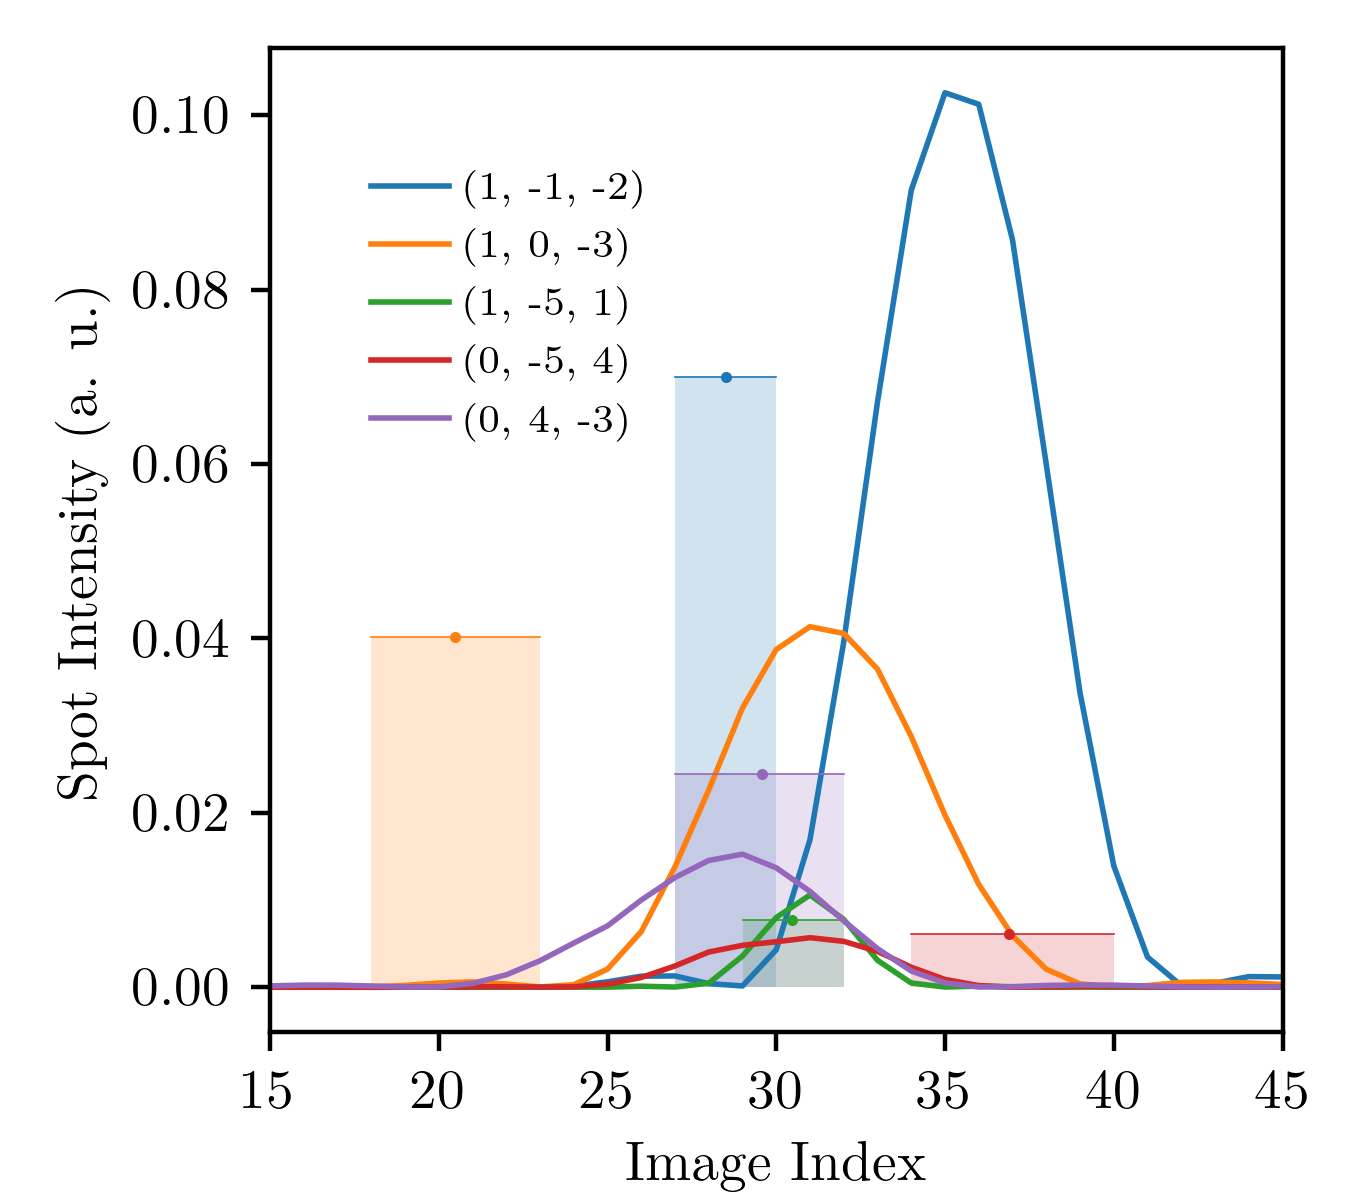
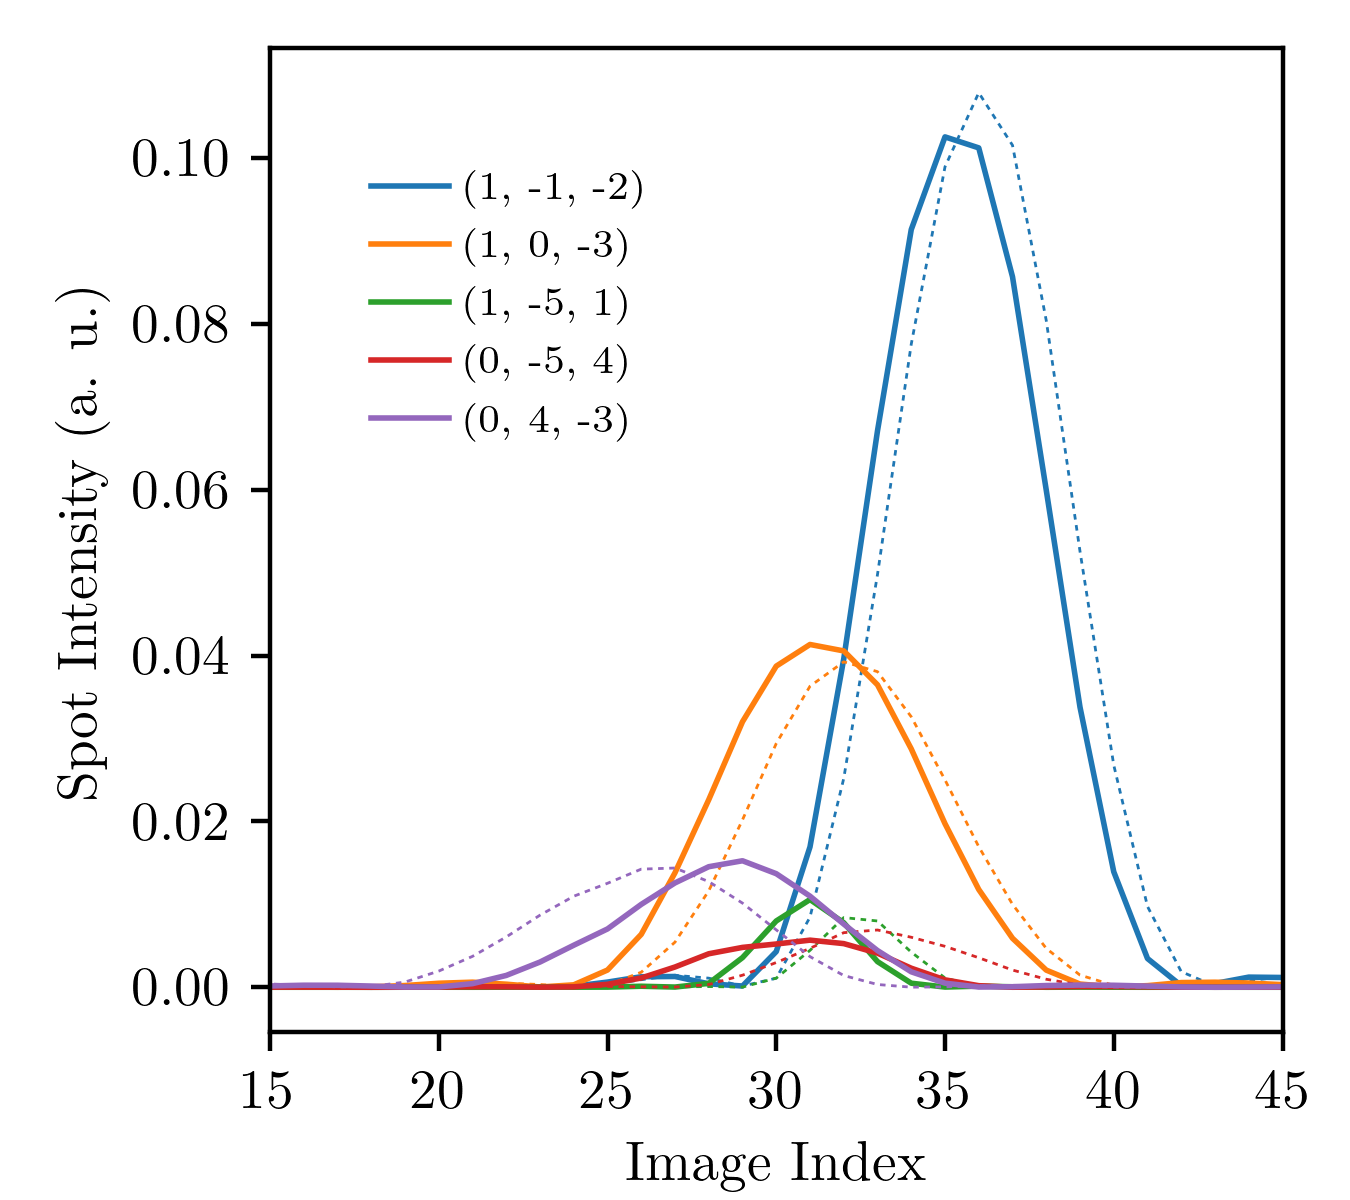
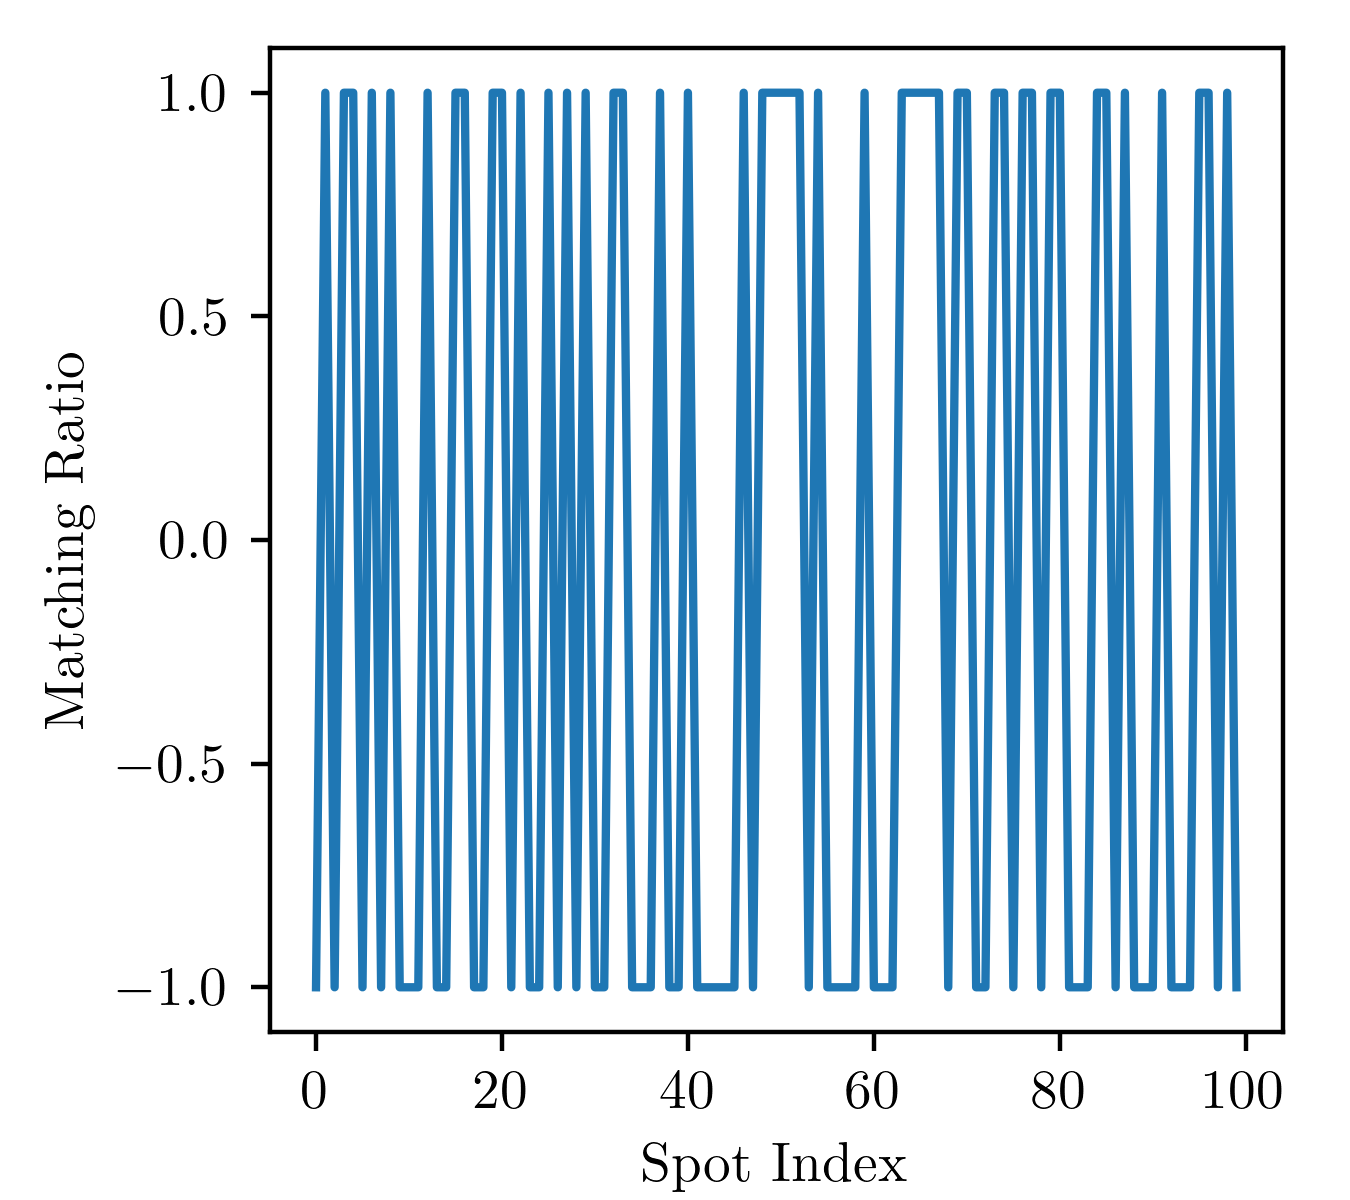
Fig. 3: The rocking curves of five random spots (close to direct beam). Sample in simulation was set to sphere with 5 nm radius. The boxes show the positions of spots in the experiment.
Fig. 4: Comparisson of the rocking curves of five random spots and their Friedel pairs (dotted curves).
Fig. 5: Mismatch between simulation and experiment on the Friedel pair ratio.
Reproducing IRELOH data is still failing because of problems with dials refinement for the first dataset.
Discussion
Focus on reproducing the original (bulk correction) results by Clabbers. The structure factors they plotted in the paper are publicly available, so it would be possible to perform the correction even without processing the original data. Also, discard noisy data (as they did in the original paper).
The fitting with GBT is already trying to compensate for existing noise in the data, so when reporting on \(R_1\) values of the fit, it would be usefull to have \(R_1\) computed for the original \(F_o\) just as a reference on how good / noisy was the original dataset.
Do principal component analysis for each parameter in the GBT model to access which one contributes the most to the determination of \(F_c\). Look at package called LIME.
Check the orientation and rotation angles of the chiral molecule in abTEM (also check the orientation in the CIF file).
Try doing scaling and merging (but keeping the Friedel pairs separate) for the chiral molecule.
Depending on the symmetry of the chiral molecule do comparison between multiple Friedel pairs (not just P1 related ones).
Compute directional vectors for Friedel pairs where the ratio is higher than sigma (since then the error is probably smalller).