29 Jan 2026
- Attendees:
Petrovic, D. McDonagh, D. Waterman, E. Krissinel
Results
Compared the spot excitation error with how much a spot is enhanced or suppressed (Figs. 1 and 2). In general, there is no one-to-one correlation between the excitation error and the dynamical effects. This is probably because the intensities are redistributed between several spots.
Another problem in determining which spots are enhanced and which are suppressed is setting an appropriate scale between Fo and Fc. Considering that the spread of spot intensities on an image-by-image basis is large (Fig. 3), it looks as though spots on individual images might behave differently than their mean (merged) intensities. For example, the spot whose merge intensity is suppressed (as compared to Fc) might be boosted on an individual image.
NOTE: We later discovered (see 12 Feb 2026) that the spread in Fig. 3 was from unscaled data. These data are kept in the scaled file, but they correspond to integrated data. The spread is still present, but is narrower after scaling.
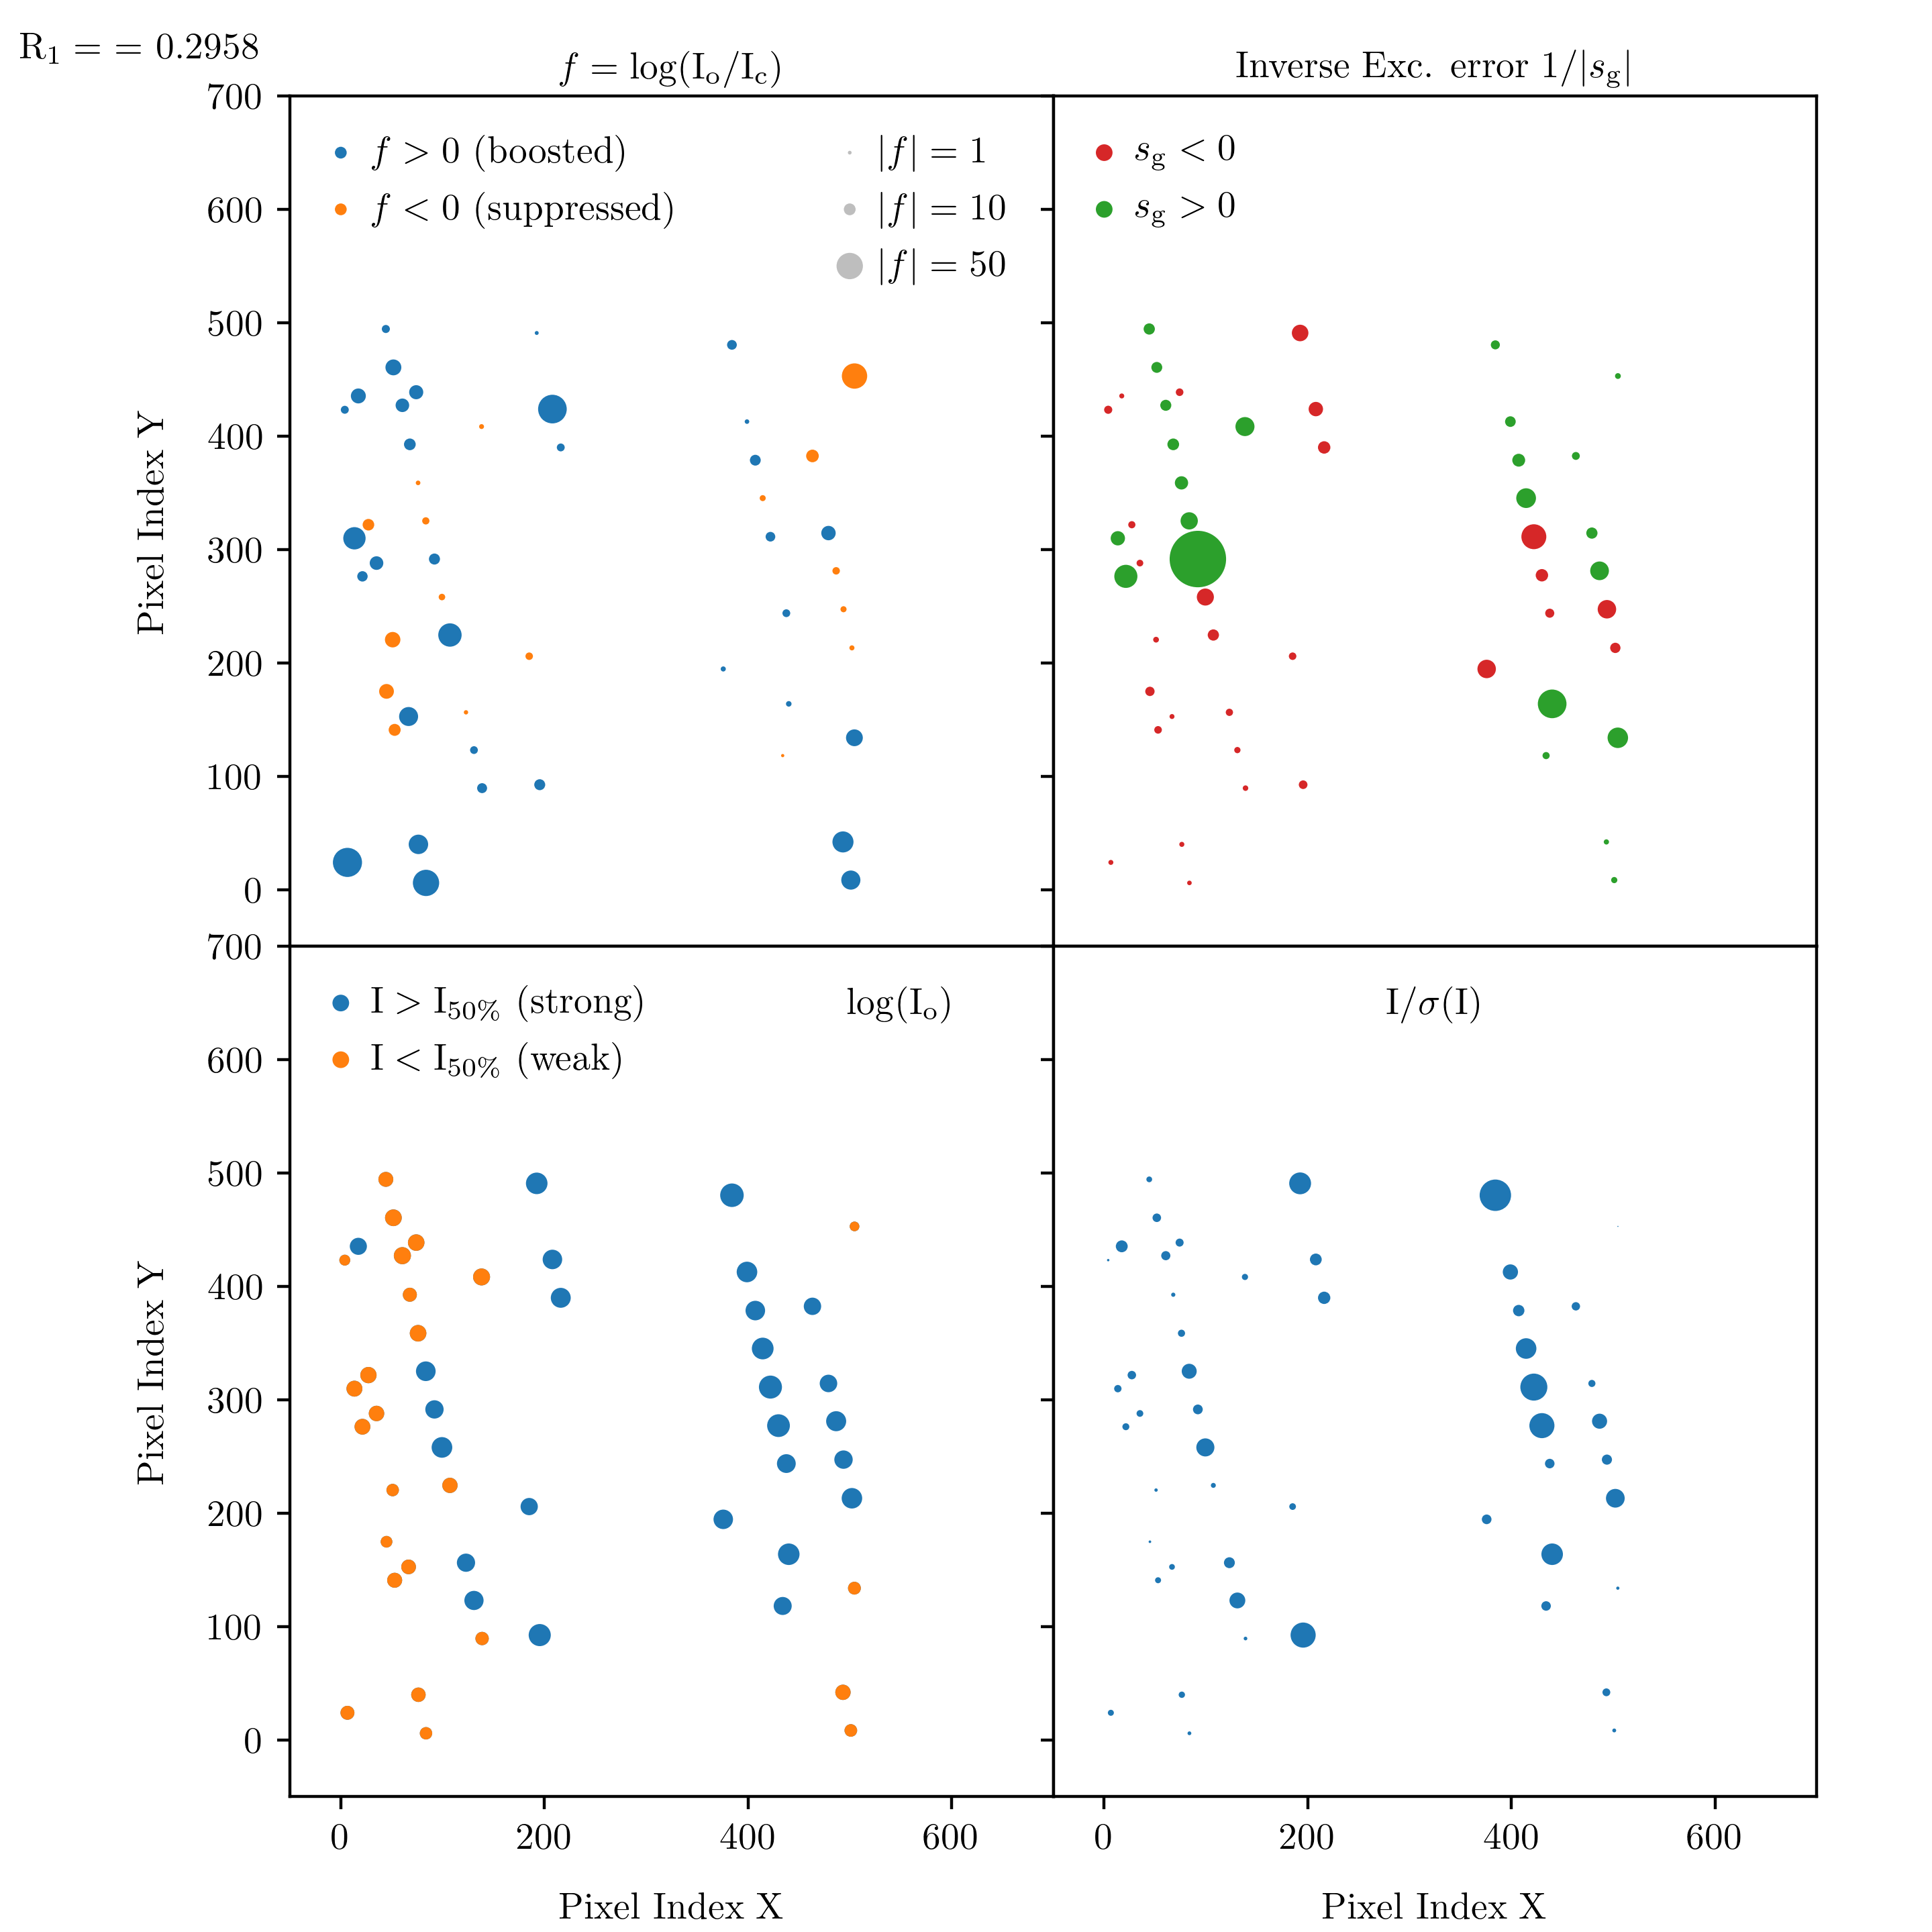
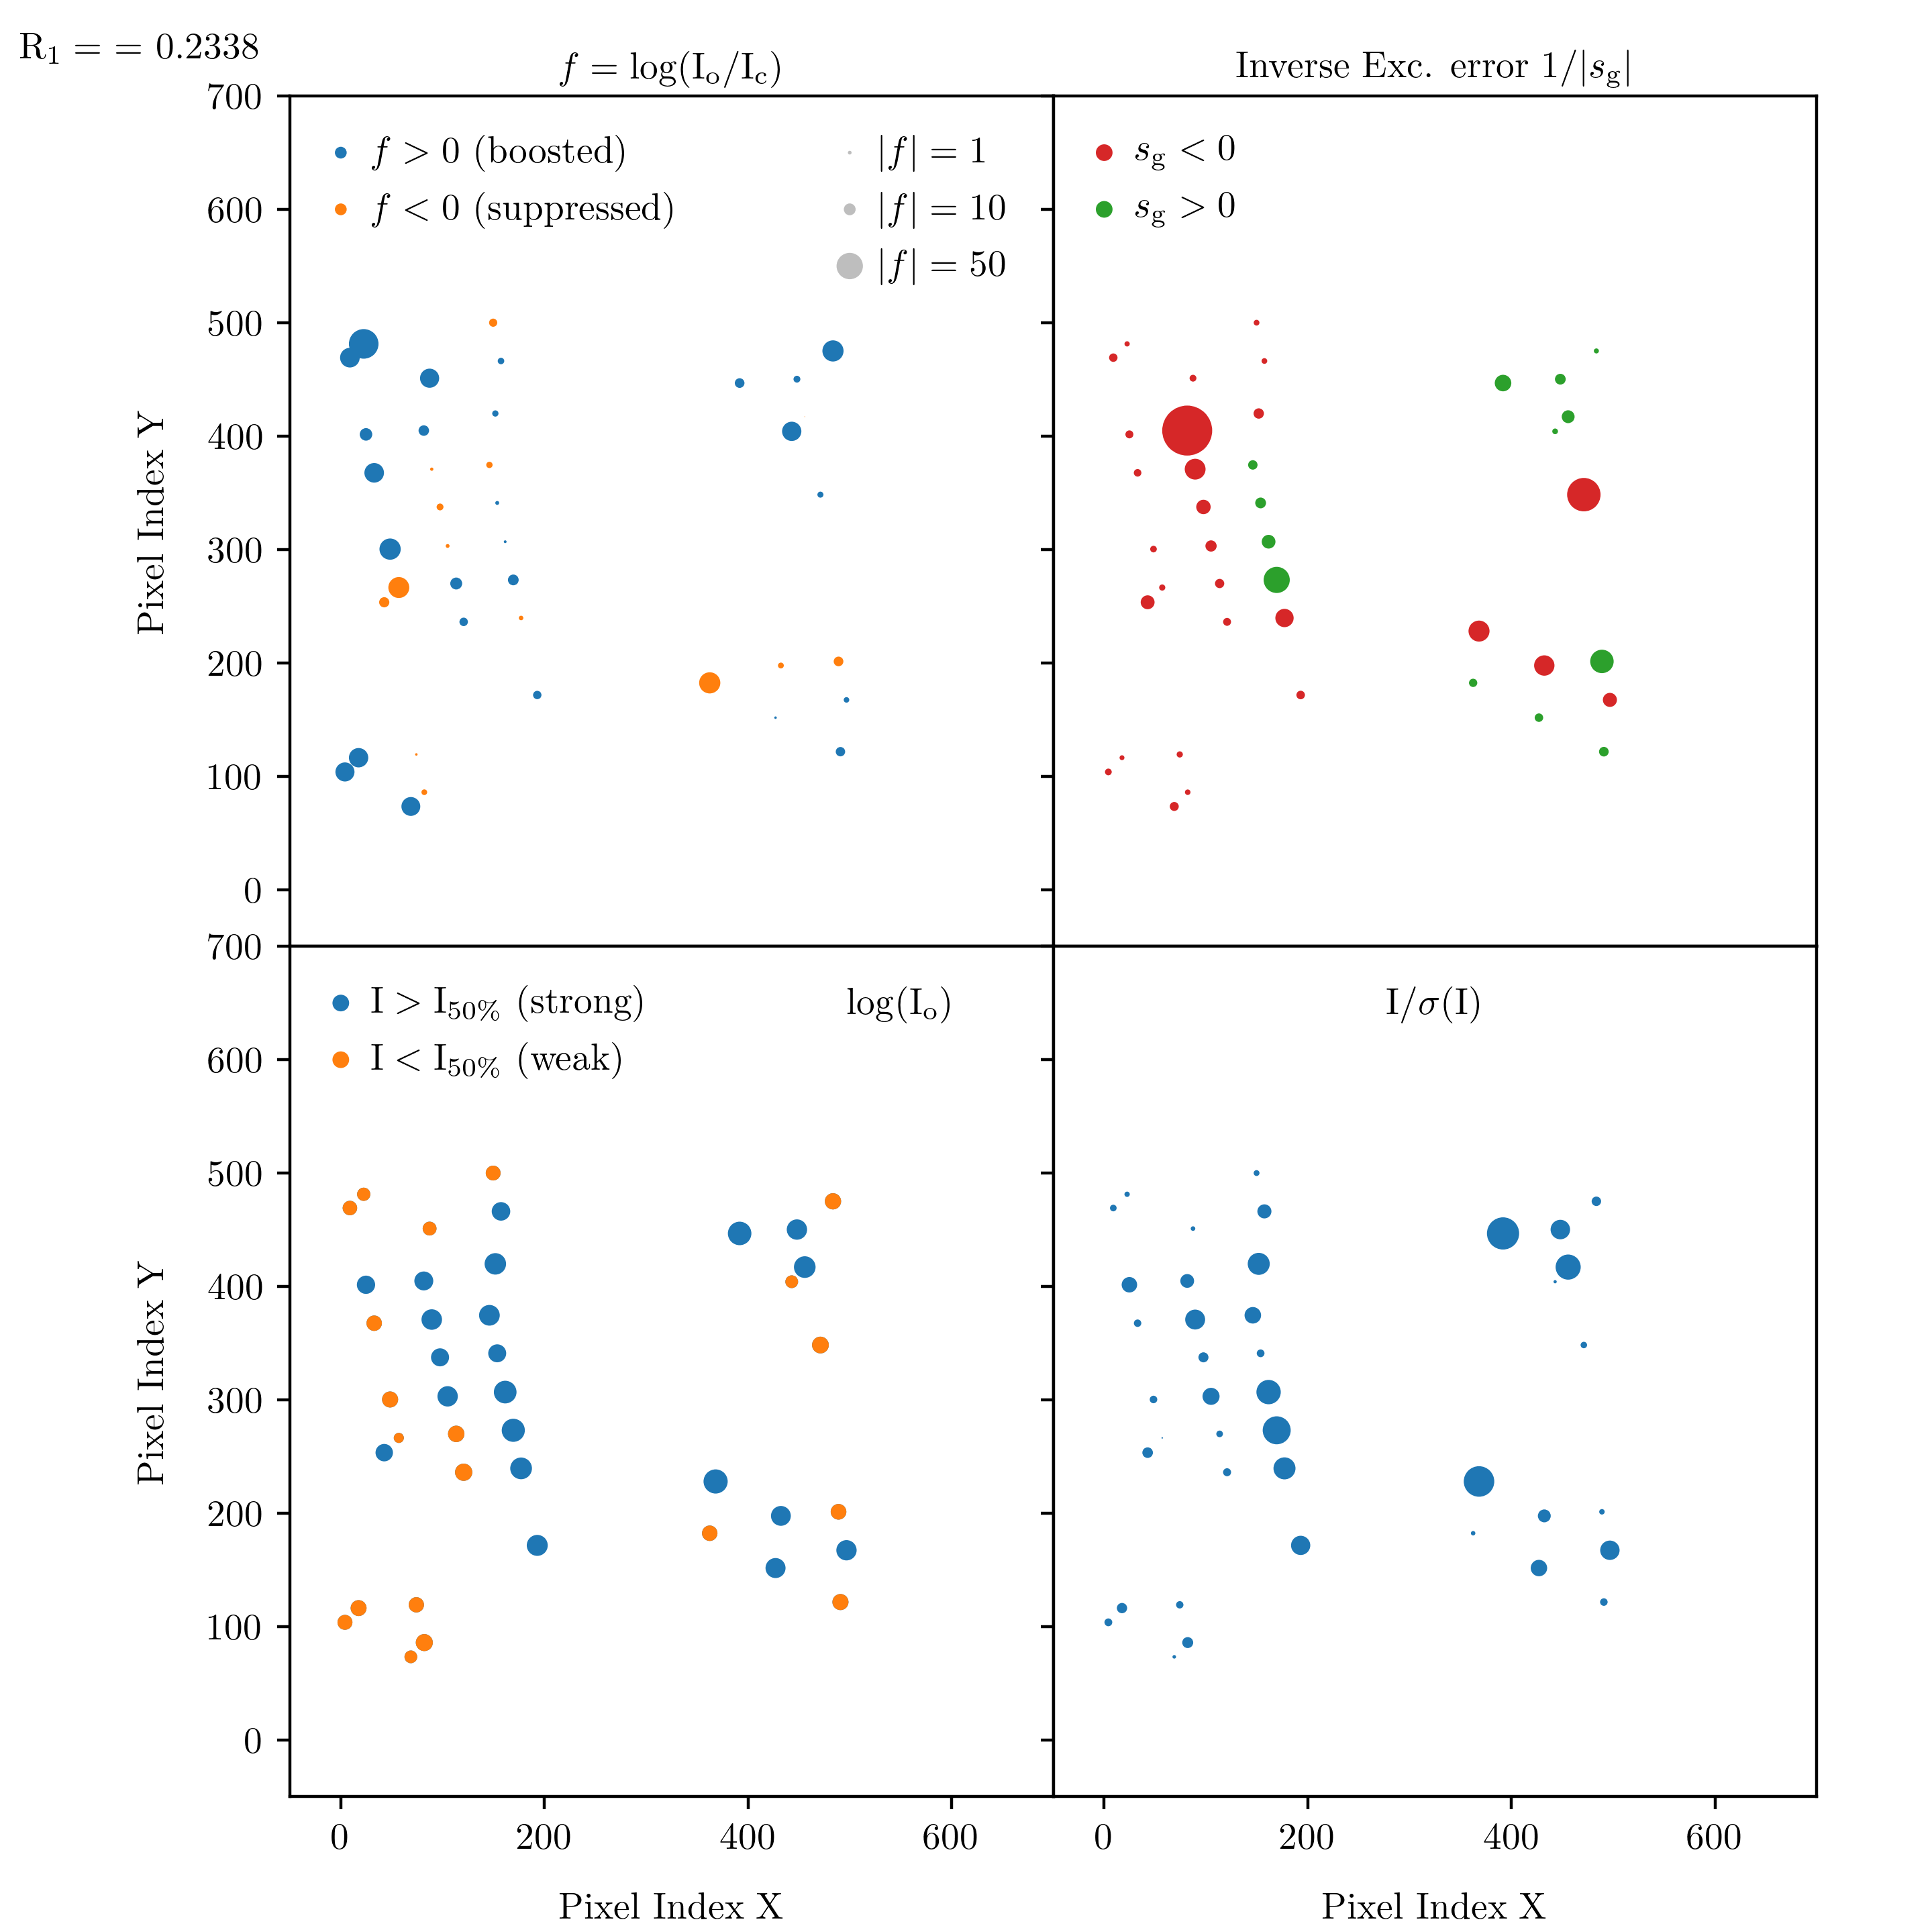
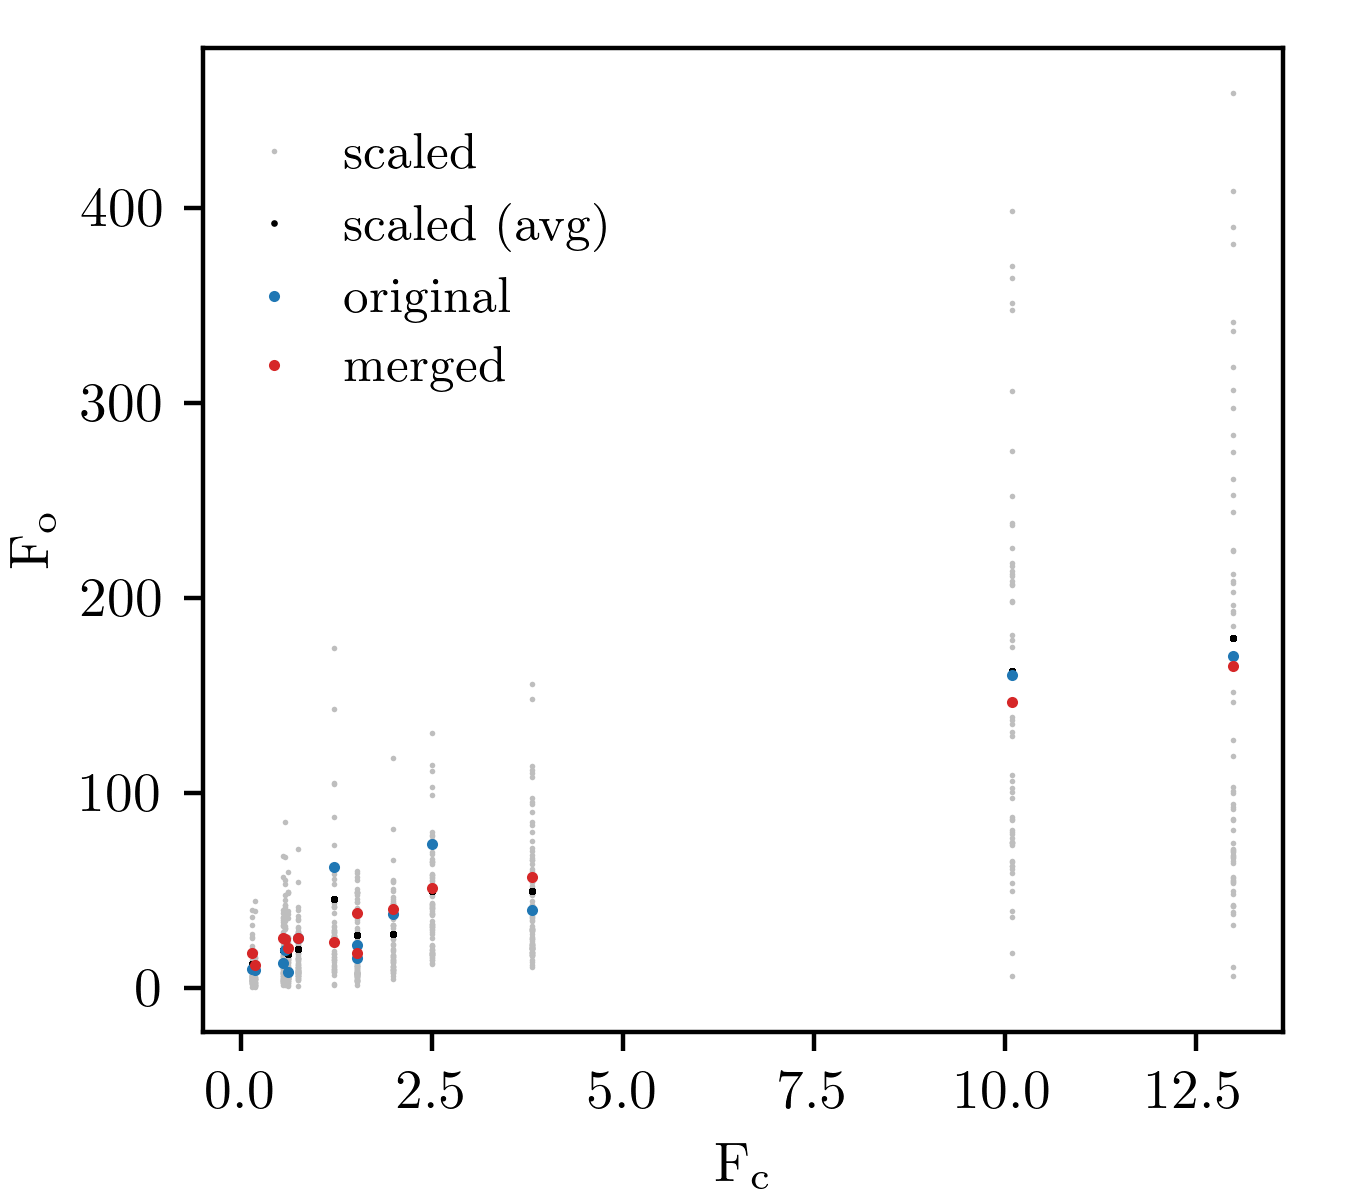
Fig. 1: Single diffraction image showing which spots are suppressed/boosted (upper left) vs their excitation error (upper right). The lower panels show whether the spot is strong or a weak one (lower left) and how strong its signal is (lower right). Paracetamol data.
Fig. 2: Sam as Fig. 1, but for a different image.
Fig. 3: A spread of selected spots in the scaled data vs their merged and averaged intensities. Paracetamol data.
Discussion
Do results get better if we eliminate noisy data (look at Rmerge and flag strong). Also, apply additional filtering to spots with high signal strength (I/sigma).
Examine how the spread of a single spot (Miller indices) is affected by its environment. Try to quantify the environment (e.g., a list of Miller indices or a Patterson map).
Run dials correlation matrix on the clustered Paracetamol datasets, to see if there are any subclusters.