12 Feb 2026
- Attendees:
Petrovic, D. McDonagh, D. Waterman, E. Krissinel
Results
Wrote a function that goes through all datasets (image by image) and compares images by the number of matching Miller indices. This allowed us to identify images with very similar orientations (see Fig. 1). Next, we compared spot intensities between the matching images and other datasets (Fig. 2). In conclusion, the spread of spots for ED in paracetamol is very large.
Repeated the whole procedure (matching Miller indices) for X-ray diffraction data for Ni DPPE material (Fig. 3). In general, the spread of spots in intensity is much lower than that of electrons.
Discovered an error in previous results. The scaled.refl file keeps the integrated intensities in the prf and sum columns. The actual scaled values are stored elsewhere (and written only when exported to shelx hkl files). This processing error was causing a much larger spread in spot intensities across all datasets (as reported previously on 29/01/26 in Fig. 3 there).
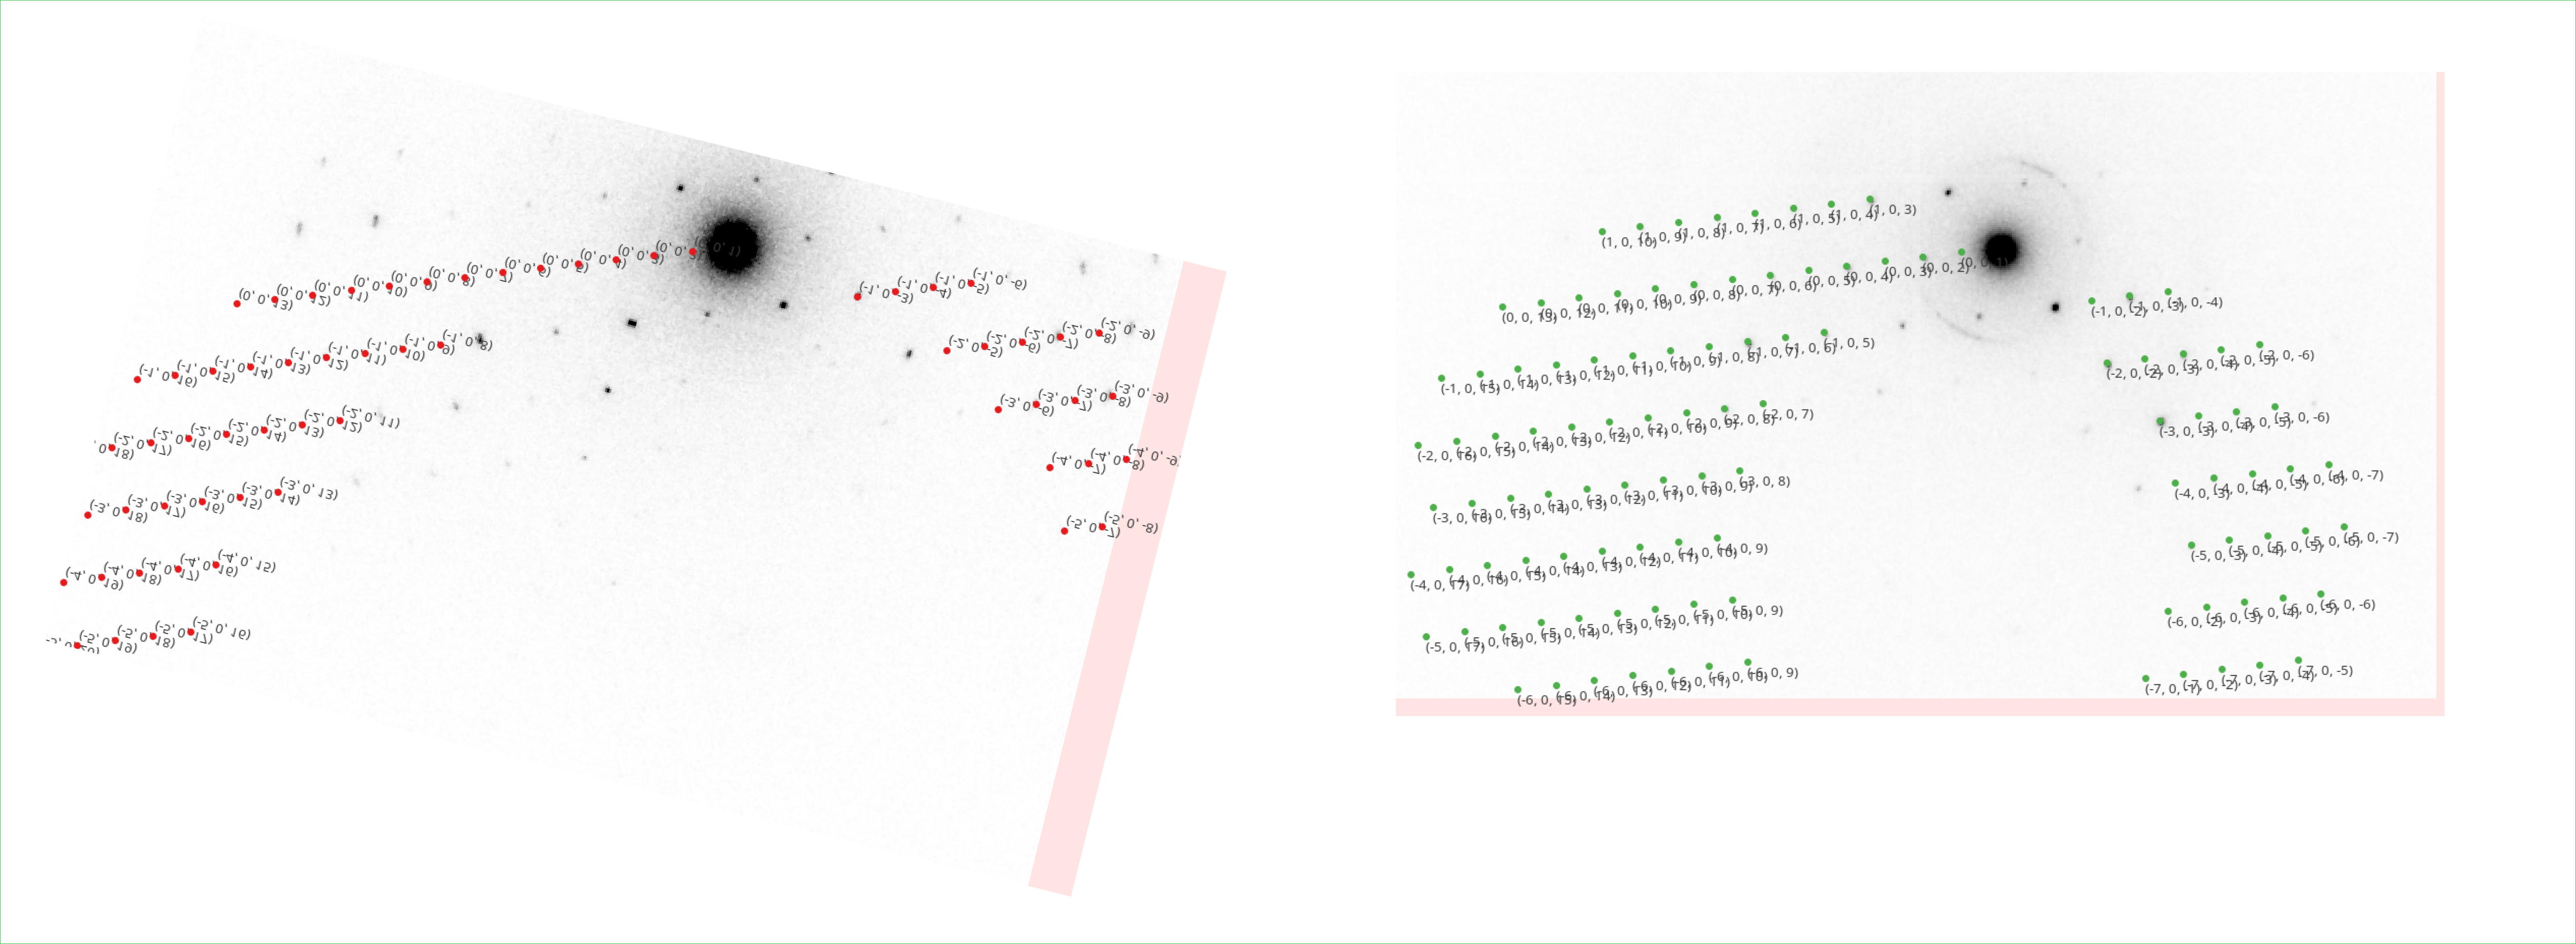
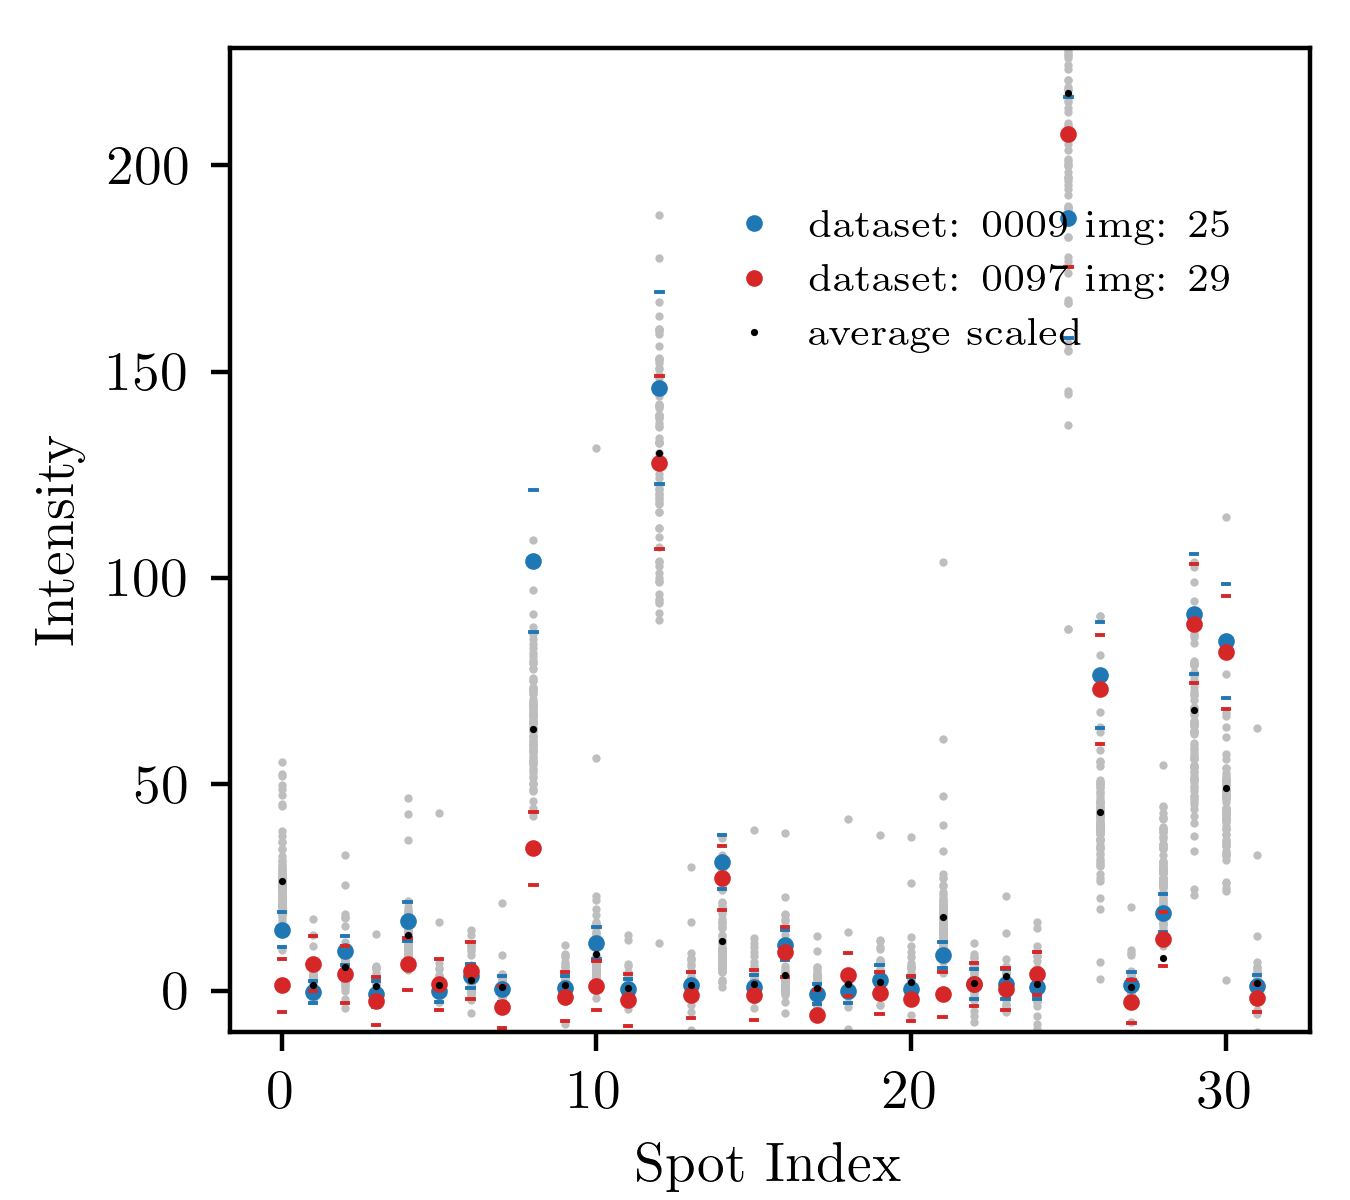
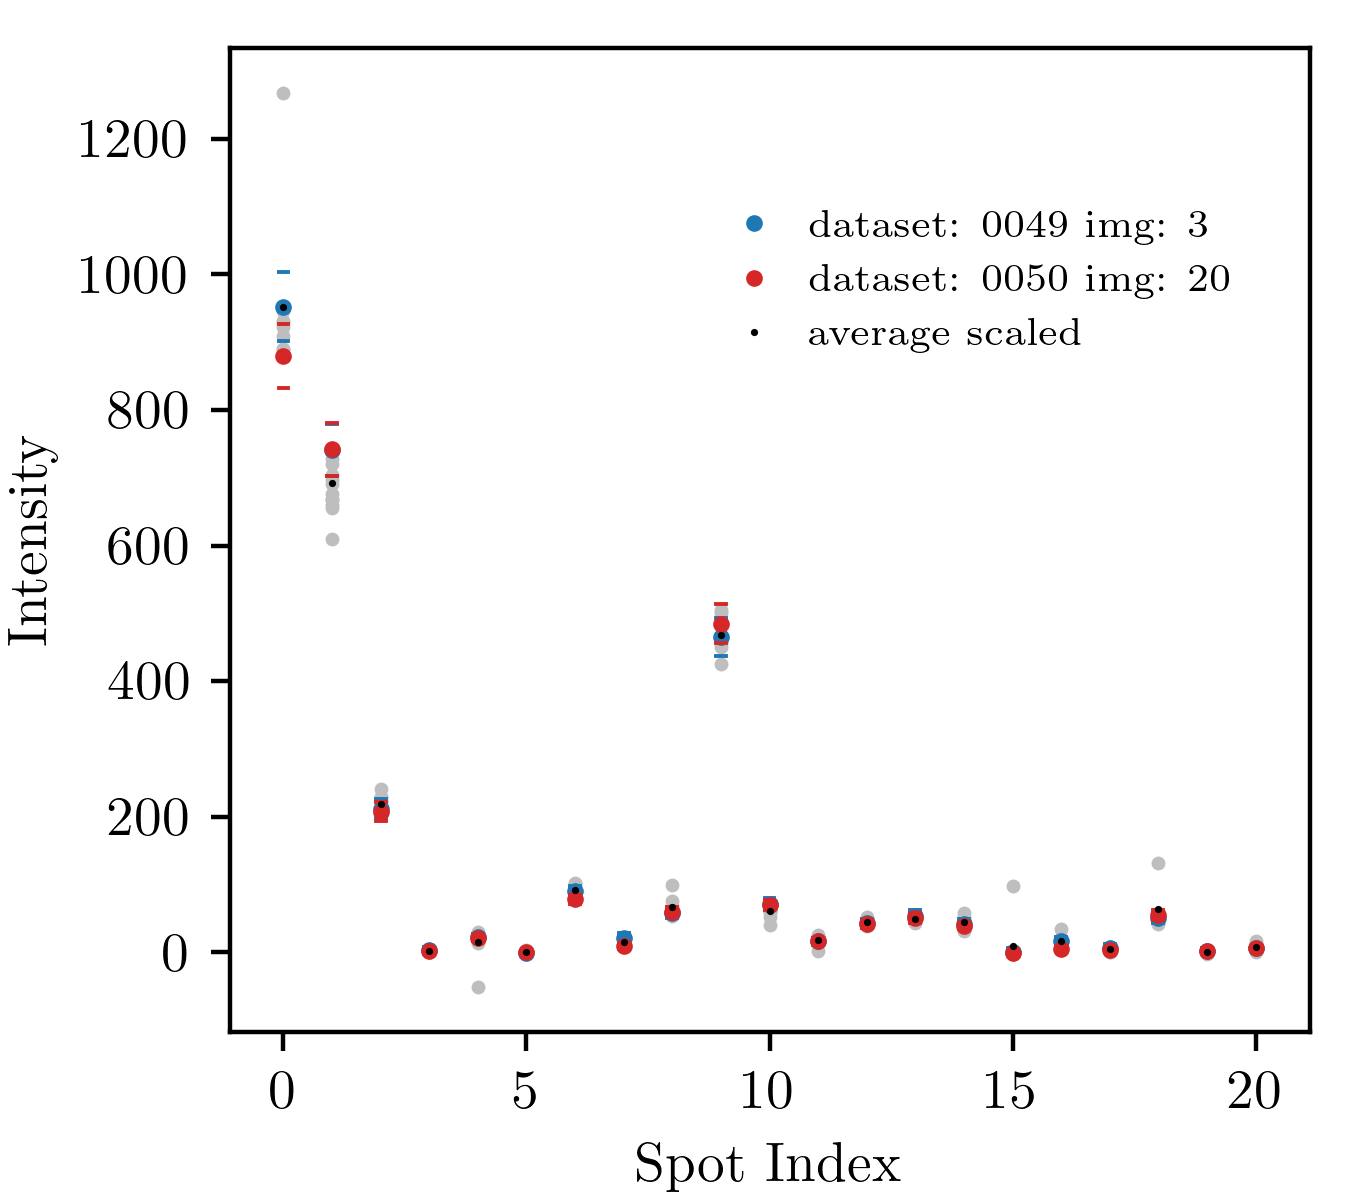
Fig. 1: An image pair where most of the Miller indices match, corresponding to two similar crystal orientations. Data for paracetamol (one degree rotation).
Fig. 2: The comparison of spot intensities for the spots found in the matching images in Fig. 1. The gray dots in the background show the spot intensities for the same Miller indices for other datasets (i. e., other orientations). The spot intensities are read from the exported HKL files (shelx export in DIALS).
Fig. 3: Same as Fig. 2, but now for an X-ray dataset.
Same as Fig. 2, but now for an X-ray dataset.
Once the error is corrected (i.e., the properly scaled intensities are read), the R1 in the GBT model drops significantly even before implementing any additional properties (Fig. 4).
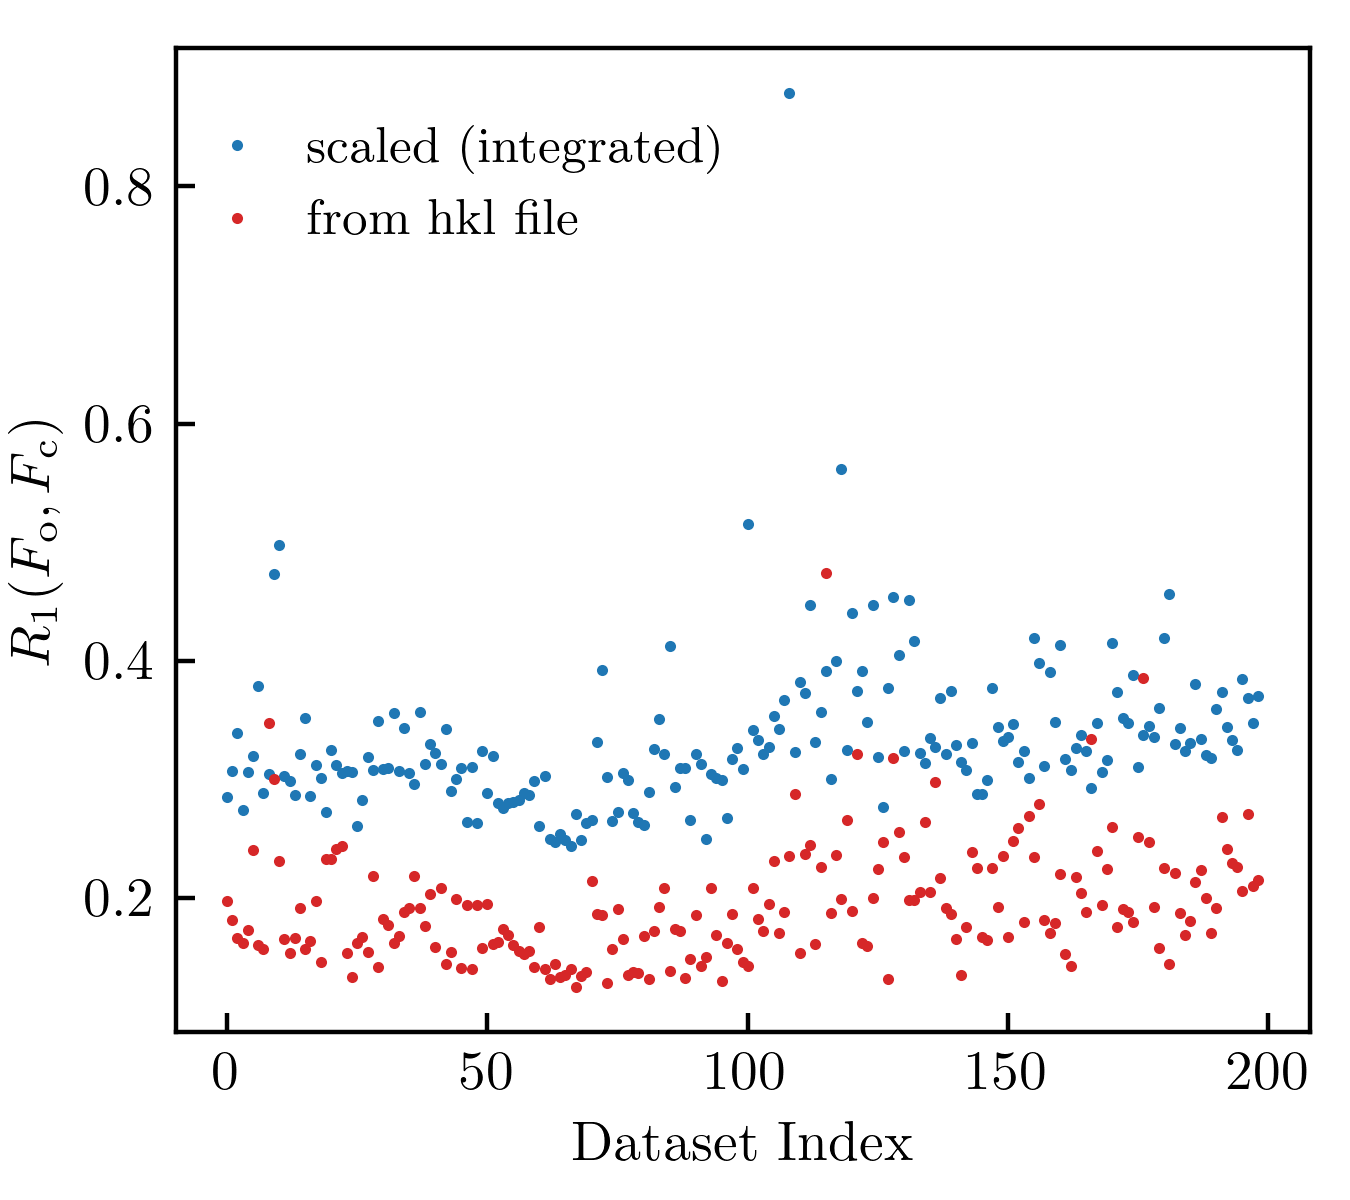
Fig. 4: \(R_1\) factor between GBT predicted structure factors and the actual values across all one degree paracetamol datasets. The GBT model was trained on the first 100 datasets and it was tested on other 100 datasets (from 100 to 200). The blue spots show \(R_1\) computed using only integrated intensities, whereas the red spots show the same \(R_1\), but now in the model trained on scaled data (which is less noisy).
Discussion
Look at the beam intensity (integrate the intensity on a circle around the beam position), or the average spot intensity, to understand why the spread in spot intensity occurs. How much of it comes from variations in beam intensity across datasets (for integrated, unscaled data)?
If the spread is Gaussian, there might be a way to compute the likelihood that the two matching spots were selected at random, rather than being correlated.
The images visually show the spread behaviour, but we still lack a way to precisely quantify spot spread across an entire dataset. Need to develop a way to quantify it.
Is the noise the same across all spots, or are there clusters of spots with low spread and others with high spread (does it depend on the spot intensity)? What is the effect of removing noisy spots? Does the spread decrease?
Do simulations run with abTEM confirm the extent of the spread? In other words, how much of the spread can be attributed to noise in measurement, and how much to a dynamical (physical) effect.
Are any of the extreme spots in the spread maybe related to special orientations (unit cell axes aligned with the beam, or the beam aligned with some of the principal axes in the crystal)?
Is the shelx solution better when we apply our model to integrated data and scale it with DIALS, or when we scale the data first and then train our model on the scaled data? At which point in the processing pipeline should our model be introduced, and is there any difference between applying it at different stages?
Since electron diffraction is better for solving structures in charged states, it would be interesting to perform first-principles simulations (Bloch-wave or Multislice) on systems where charge is introduced by hand, and compare the resulting diffraction data with that for the neutral case.