26 Feb 2026
- Attendees:
M. Petrovic, D. Waterman, E. Krissinel, R. Nicholls, A. Konstantinov, M. Kumar
Results
Implemented interpolation of the rotation angles extracted from data files (Fig. 1). The rocking curves can now be computed not just for integer image indices, but for any number in between, producing smoother curves for low thicknesses (Fig. 2). As the thickness of the crystal increases, the rocking curves become more jittery and less smooth (Fig. 3).
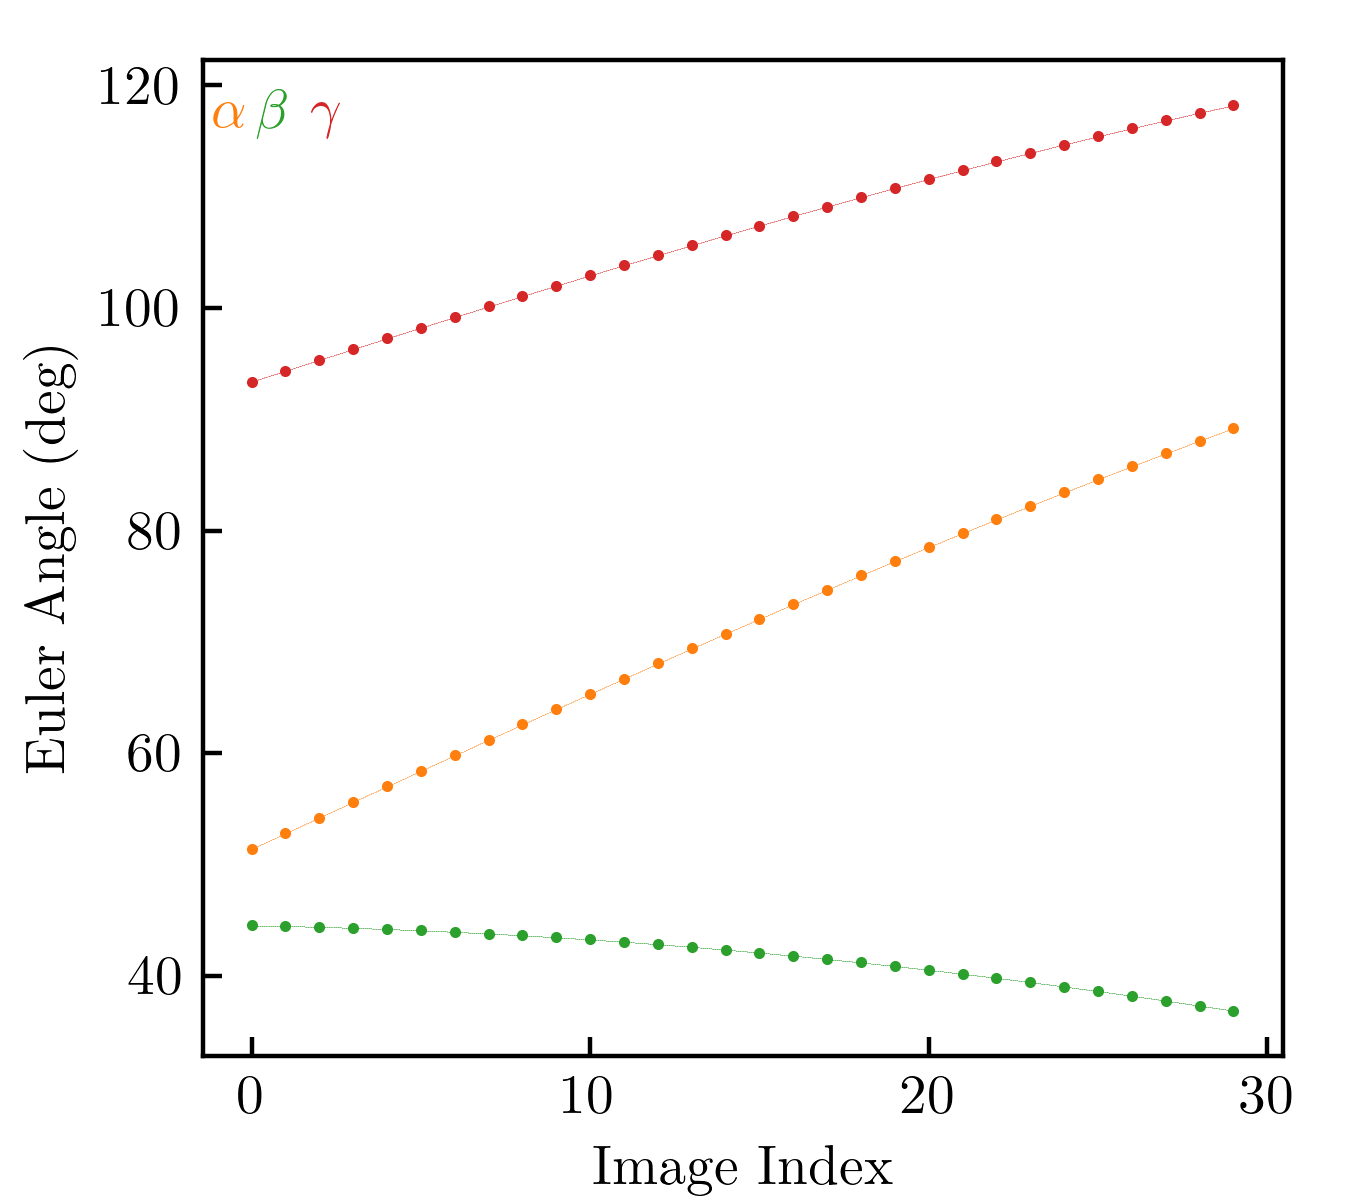
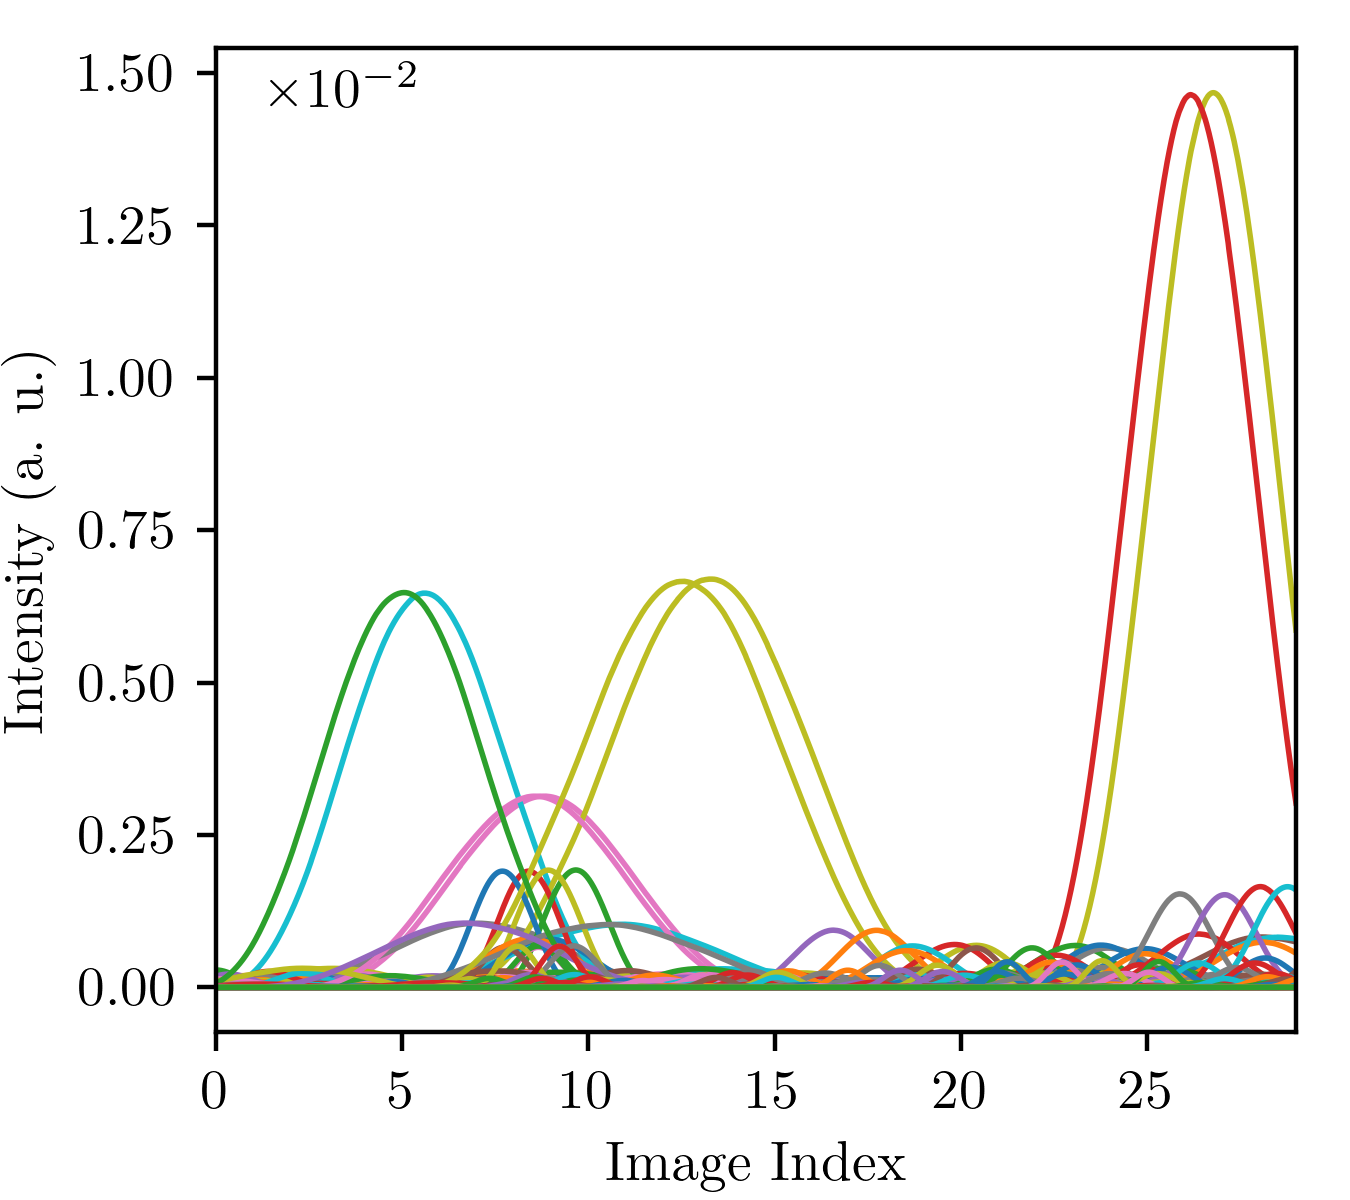
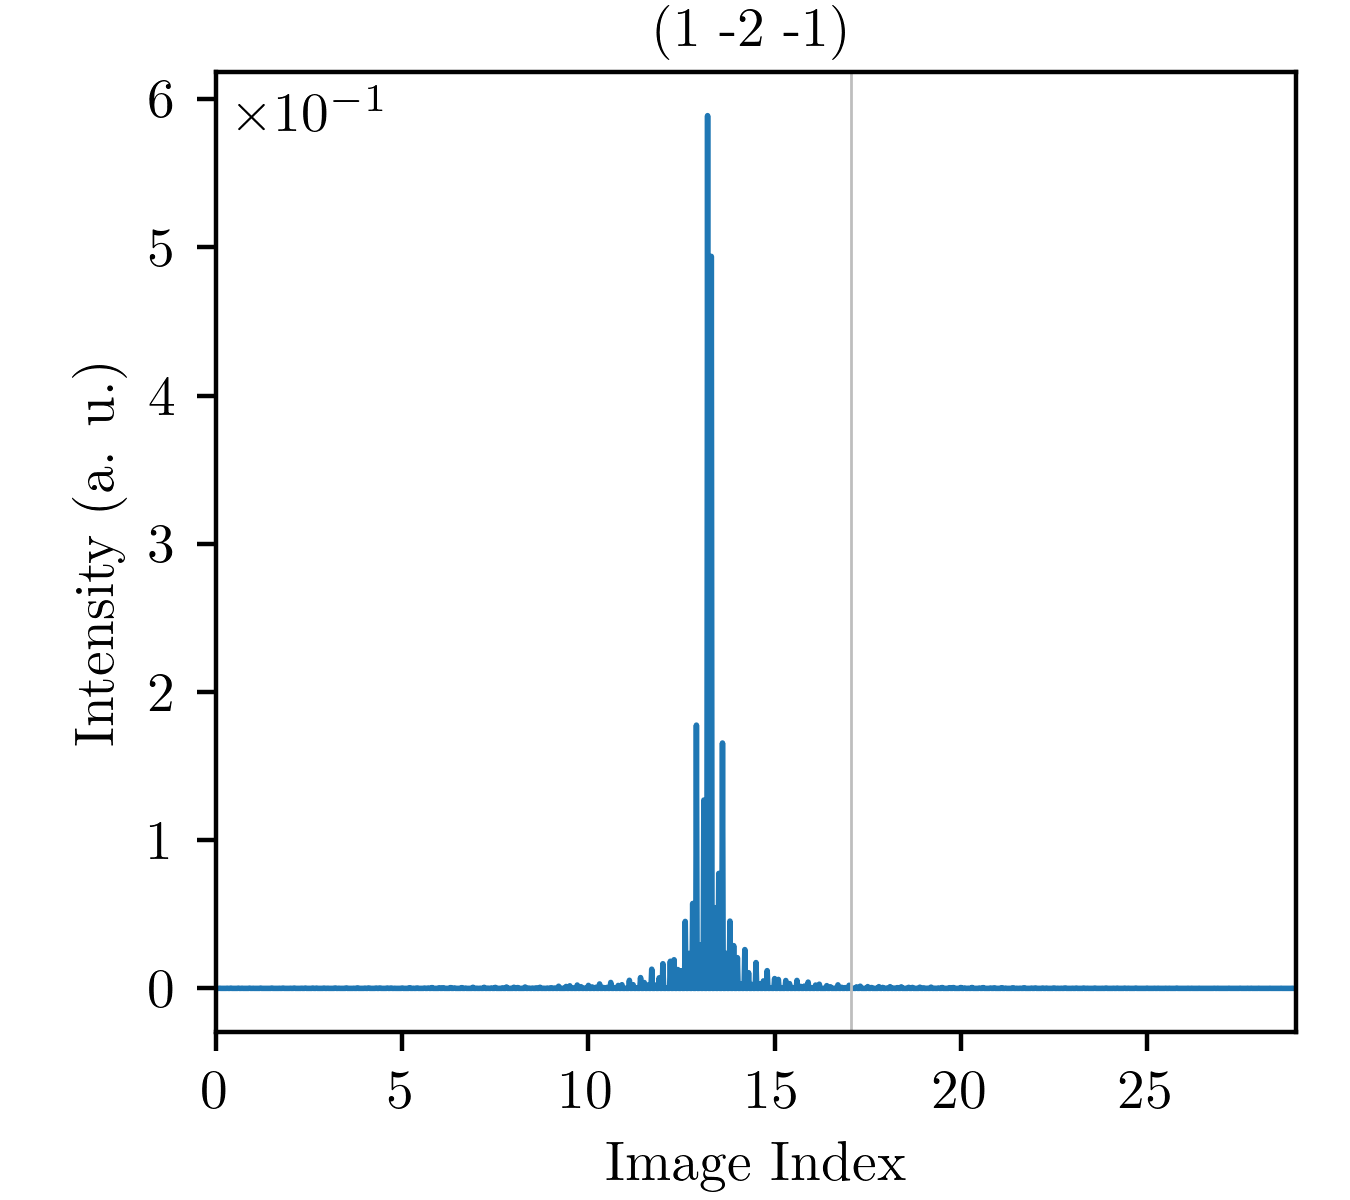
Fig. 1: Interpolation of the three Euler angles from a single rotational scan dataset (the same Paracetamol dataset was used last week to compute rocking curves).
Fig. 2: Rocking curves computed for the same dataset as in Fig. 1. The thickness was set to 6 nm. Computed using the Bloch wave method.
Fig. 3: A single rocking curve from the same rotational scan/dataset used in Fig. 1 and Fig. 2, but now for a thickness of 150 nm.
Performed abTEM simulations on a single dataset with smooth angle interpolation (full scan). The crystal for the given measurement is shown in Fig. 4. Based on the crystal’s size, it is clear that the Multislice simulation cannot be used for this case, as the computational cell must be in microns. Therefore, we used only the Bloch wave simulation. Fig. 5 shows \(R_1\) factors as a function of thickness and with different filtering applied to the input data. Based on this graph, the estimated crystal thickness is around 170 nm. Fig. 6 shows the match between the simulation and the experiment when only the strongest (high signal-to-noise ratio) spots are selected.
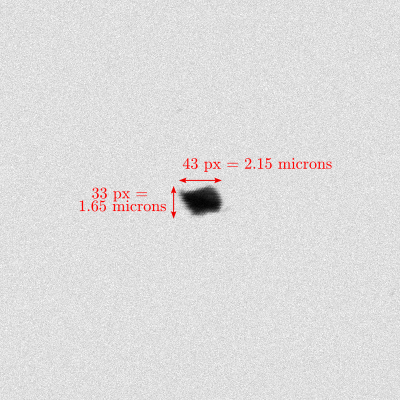
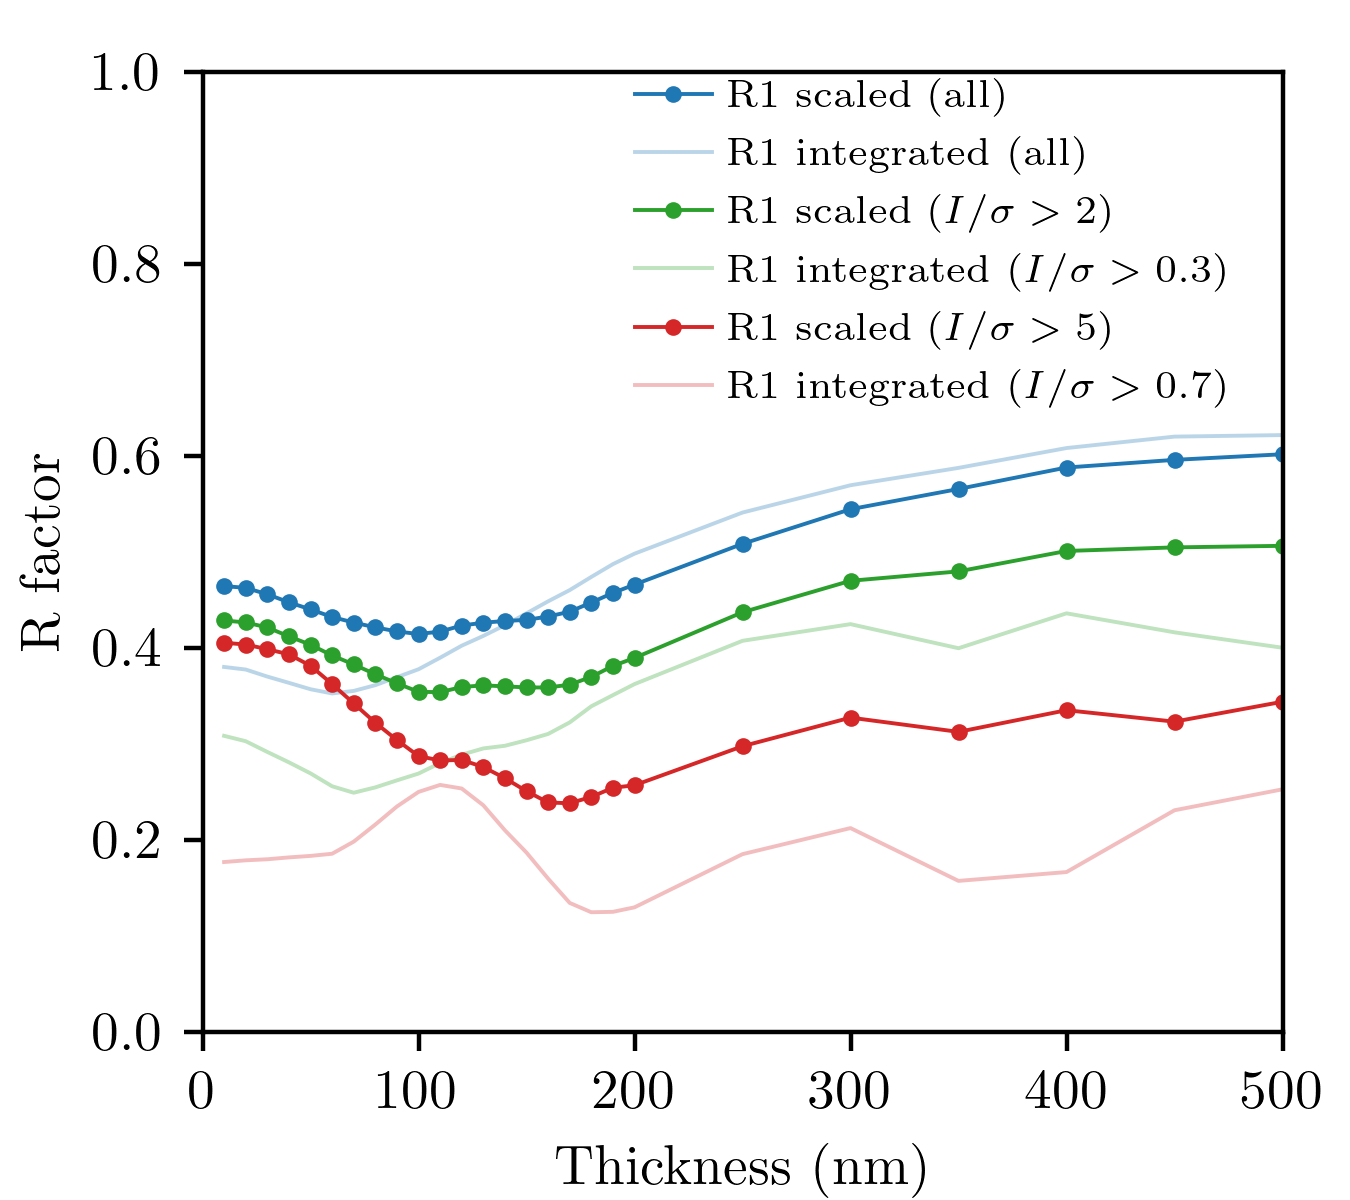
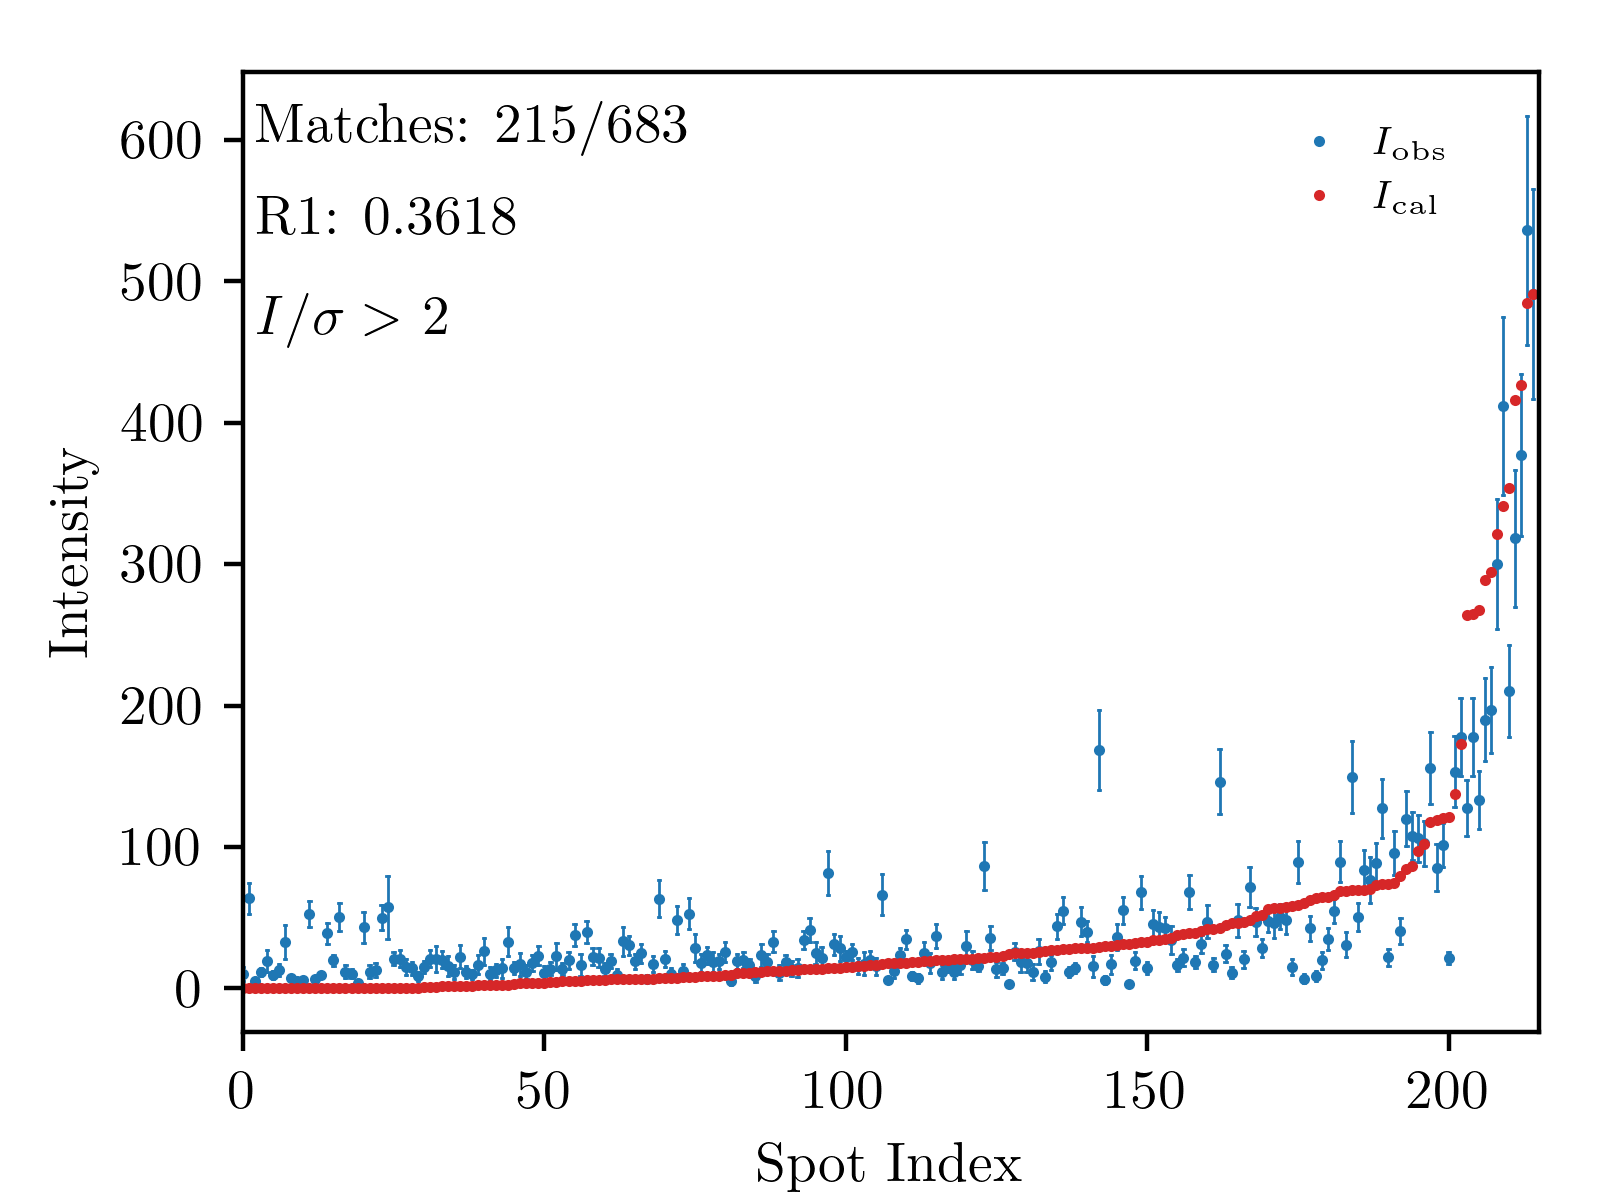
Fig. 4: The STEM image of the crystal for which we performed the abTEM Bloch wave simulation.
Fig. 5: Scan of the R1 factor for the same Paracetamol dataset as in Figs. 1-4 but for different thicknesses and different data filtering.
Fig. 6: Comparison of the abTEM integrated intensities with the scaled intensities for a Paracetamol crystal. Only the strongest spots were chosen for comparison.
The measured and simulated results do not exactly match, but, as shown previously, they provide an accurate order-of-magnitude estimate of spot intensity. Given that there are more than 600 spots in this dataset, we can cherry-pick the ones that match the simulation (Fig. 7). However, this is not the correct approach.
We benchmarked the precision of the abTEM Bloch wave method as a function of the number of selected beams and crystal thickness for Paracetamol data (Fig. 8). The conclusion is that \(k_{\rm max} = 4\) is sufficient for thicknesses below 40 nm, while \(k_{\rm max} = 6\) is sufficient for thicknesses up to 100 nm. Note that this was all compared to the maximal \(k_{\rm max} = 7\) used (calculations for \(k_{\rm max} = 8\) took too long and had to be stopped before completion).
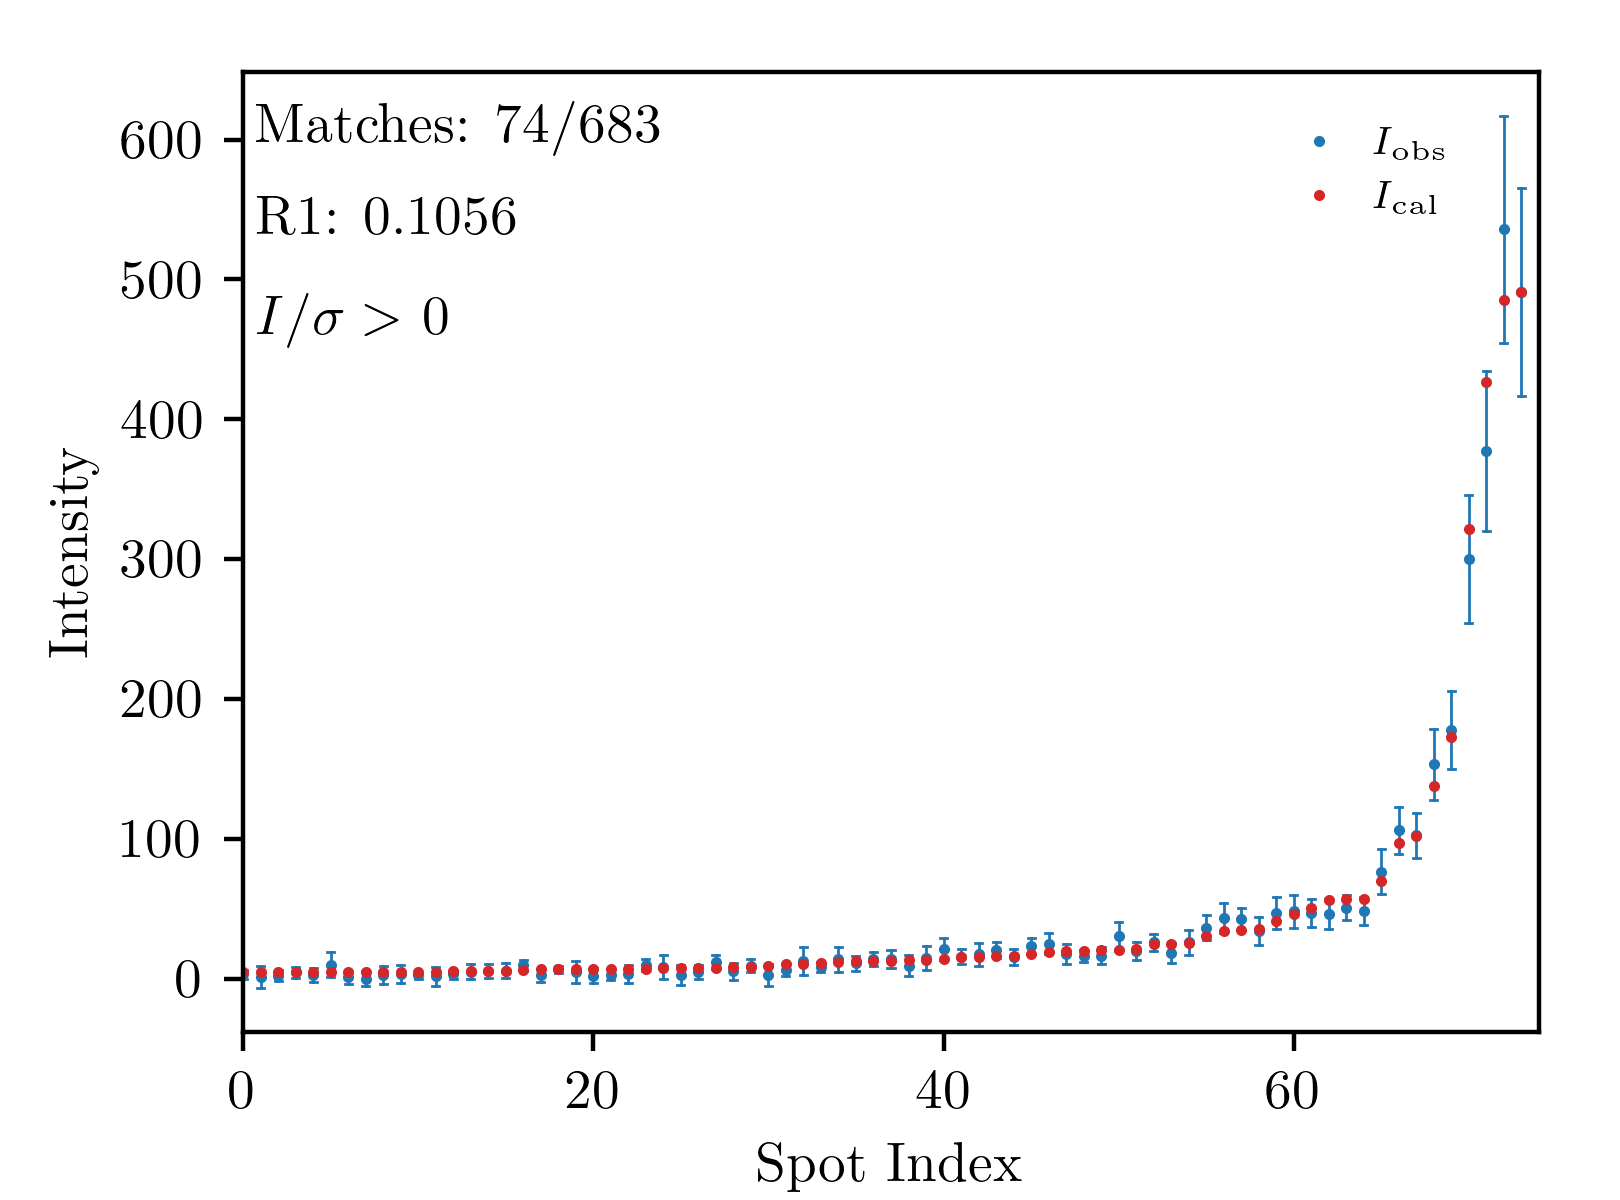
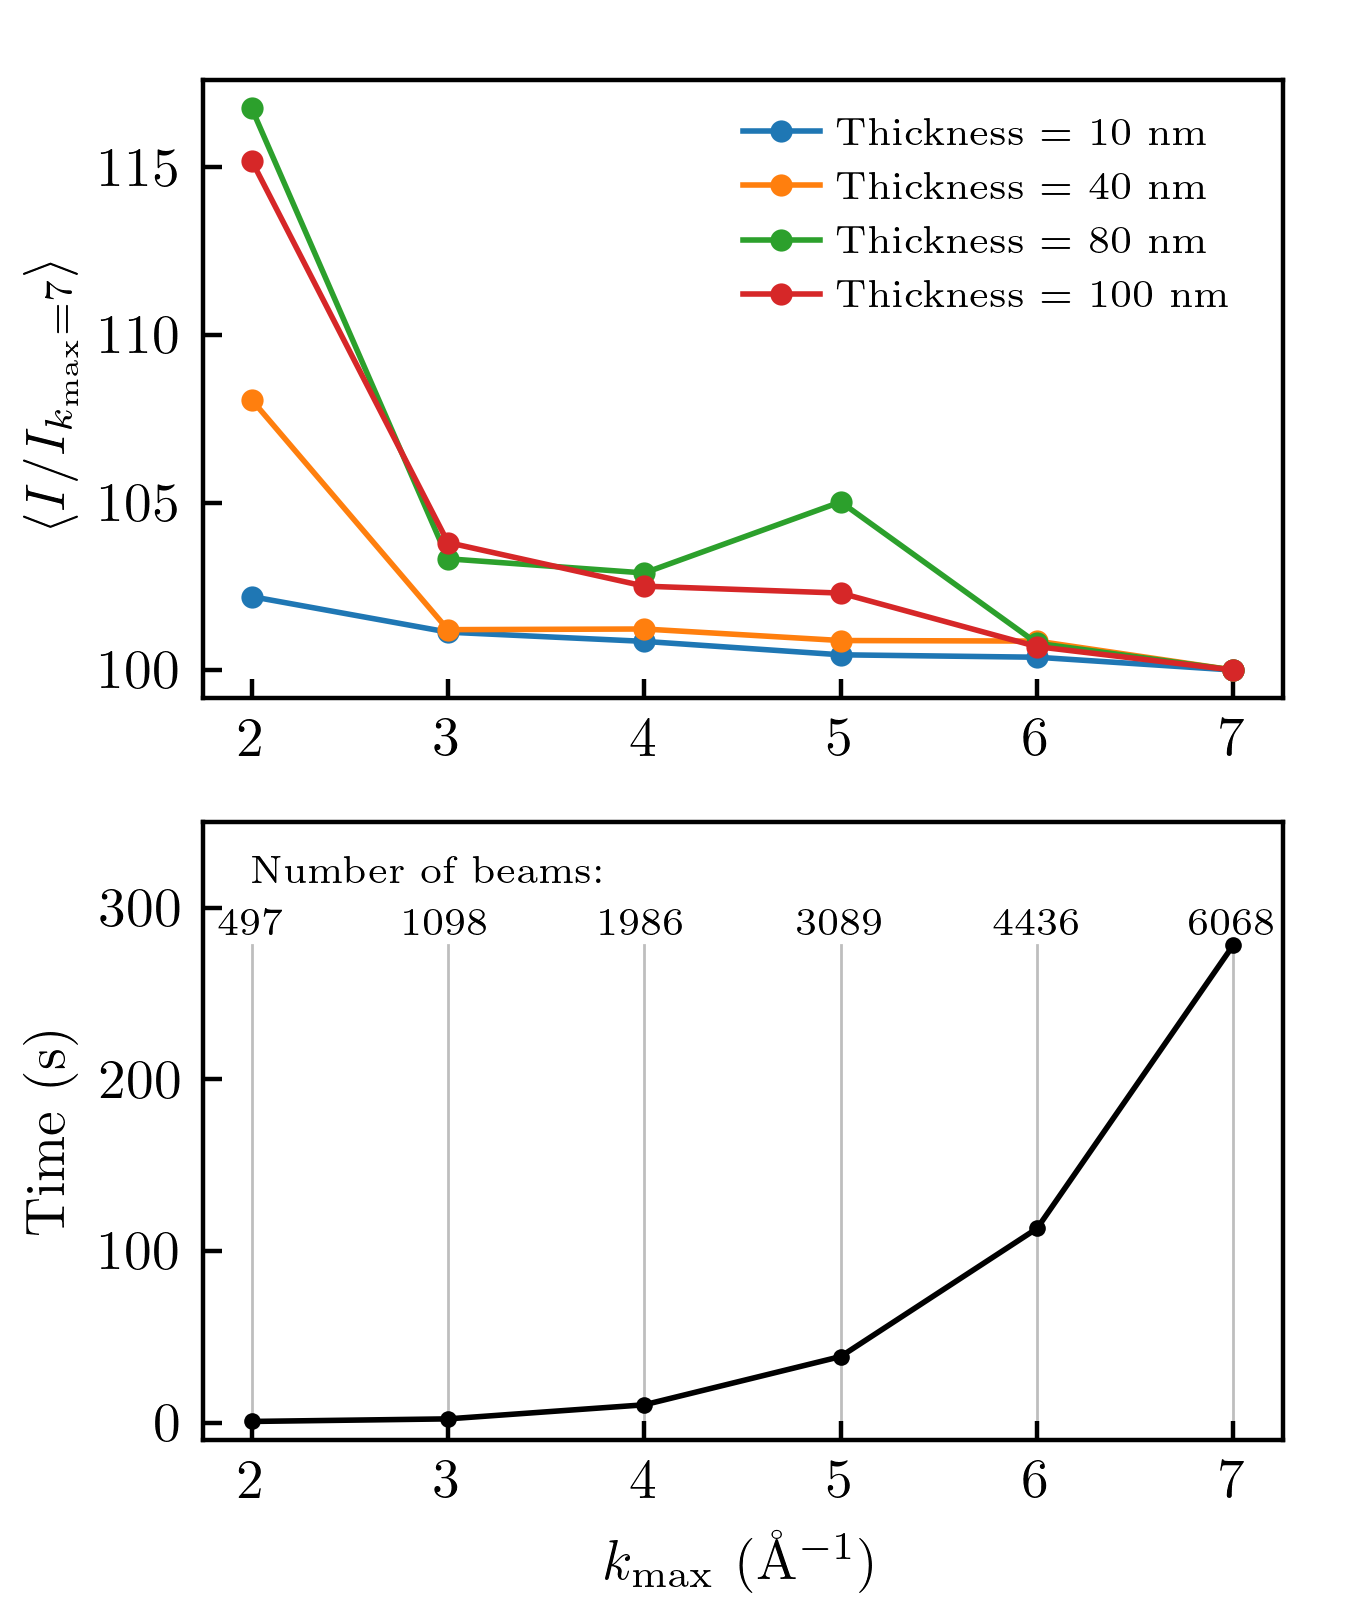
Fig. 7: Same as Fig. 6, but now showing cherry-picked spots where abTEM simulation gives a result that is within one sigma of the measured value.
Fig. 8: Benchmark of the abTEM Bloch wave simulation for different values \(k_{\rm max}\) parameter (sets how many beams to include in the simulation). The top panel shows the average ratio (averaged over high-intensity spots) between simulations with lower \(k_{\rm max}\) and those with \(k_{\rm max} = 7\) (for different thicknesses). Instead of computing the full rocking curves, the comparison is done for a single angle. The lower panel shows the computation time for a single angle.
Discussion
How do \(R_1\) factor changes for Bloch wave simulation as a function of thickness? Is there a good match with the kinematic approximation for thin crystals?
How does the match between our GBT method and actual results behave when plotted as a function of resolution?
Even for a crystal of fixed thickness, the rotation will modify the thickness. Compute the magnitude of this change for different shapes, thicknesses, and rotation angles. If the change is significant, this should be included in the simulation.
Is there a way to include the temperature effect in the abTEM simulation? At the current state, are all results considered to be at zero temperature?